Skip to main content
Explore
Solutions
Services
Pricing
Quick Start
Demo
Start free
Log in
Send feedback
✕
Tell us what works and what could be better. We read every submission.
Send feedback
✕
Tell us what works and what could be better. We read every submission.
C
cynichole
@cynichole
·
40 public vizzes
organizational graph
Mar 22, 2022
D3 Force Layout
Mar 22, 2022
Voronoi with labels
Mar 21, 2022
Coronavirus Log scale Live Data Voronoi
Mar 21, 2022
Coronavirus Log scale Live Data
Mar 18, 2022
Coronavirus Log scale
Mar 18, 2022
Corona virus Linear Y axis
Mar 17, 2022
React + d3 Axes
Mar 17, 2022
Line chart Margin convention
Mar 16, 2022
Coronavirus Line Chart
Mar 16, 2022
Summarising coronavirus data
Mar 16, 2022
Loading and Parsing coronavirus data
Mar 14, 2022
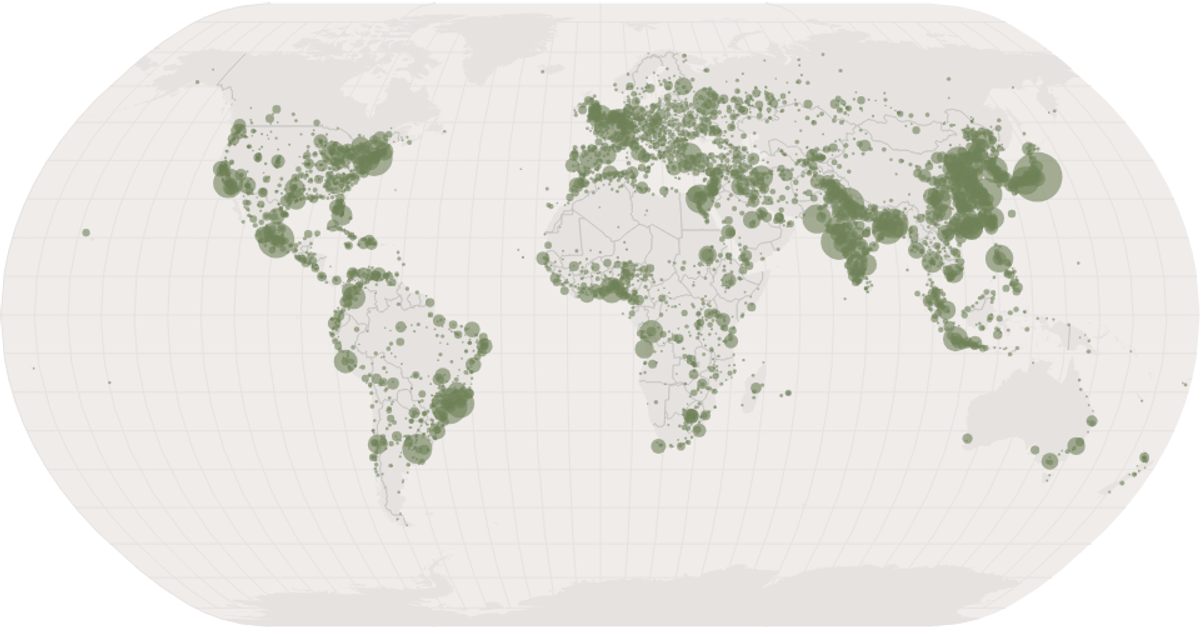
HIV/AIDS Choropleth Map
Mar 10, 2022
Log Scale
Mar 9, 2022
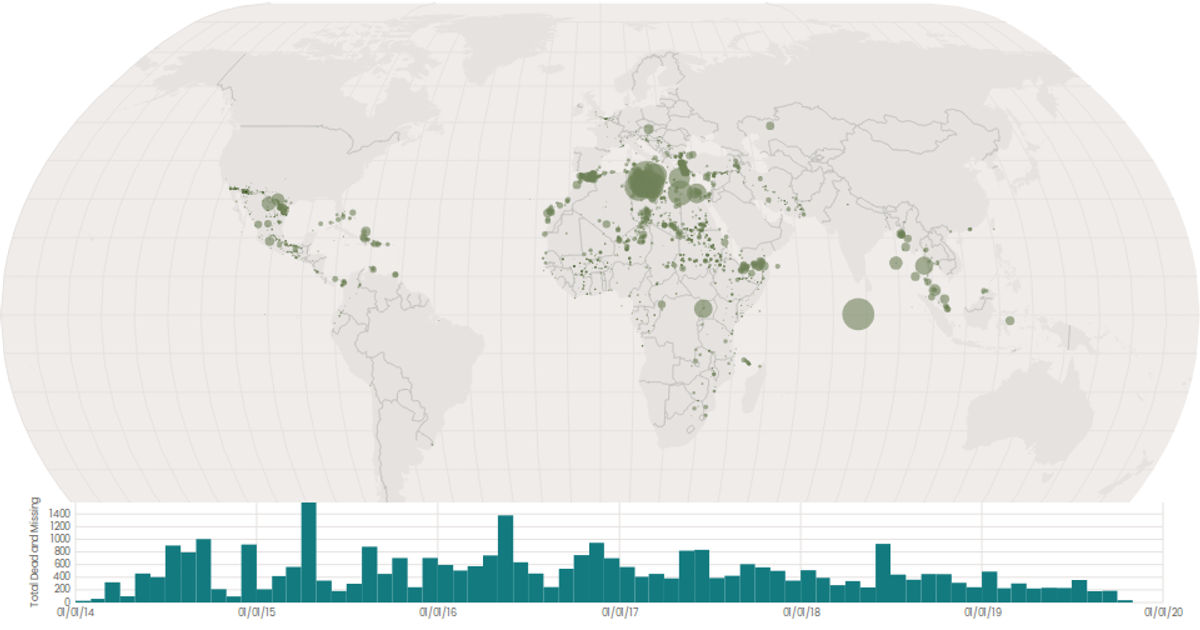
Missing Migrants
Mar 9, 2022
Brushing
Mar 8, 2022
Missing Migrants Date Histogram
Mar 8, 2022
Missing Migrants on a map
Mar 7, 2022
Points on a map
Mar 7, 2022
Interactive Color Legend
Mar 4, 2022
Scatter Plot with Color Legend
Mar 3, 2022
Scatter Plot with Color
Mar 3, 2022
Polished Scatter Plot with Menus
Mar 3, 2022
Scatter Plot with Menus
Mar 3, 2022
Dropdown Menu
Feb 24, 2022
React Starter Code
Feb 24, 2022
Map of the World
Feb 22, 2022
Working with Time
Feb 22, 2022
Scatter Plot
Feb 22, 2022
Stylized Bar Chart
Feb 21, 2022
Refactored Bar Chart
Feb 18, 2022
Axes with React and D3
Feb 18, 2022
The Margin Convention
Feb 18, 2022
Bar Chart D3
Feb 18, 2022
Fork of Redndering data with React
Feb 17, 2022
Redndering data with React
Feb 17, 2022
Fork of Vega-Lite API Template
Feb 17, 2022
Loading and Parsing CSV data
Feb 16, 2022
Mouse Follower
Feb 14, 2022
Smiley Face Part I
Feb 11, 2022