🌍 Public
Summarising coronavirus data
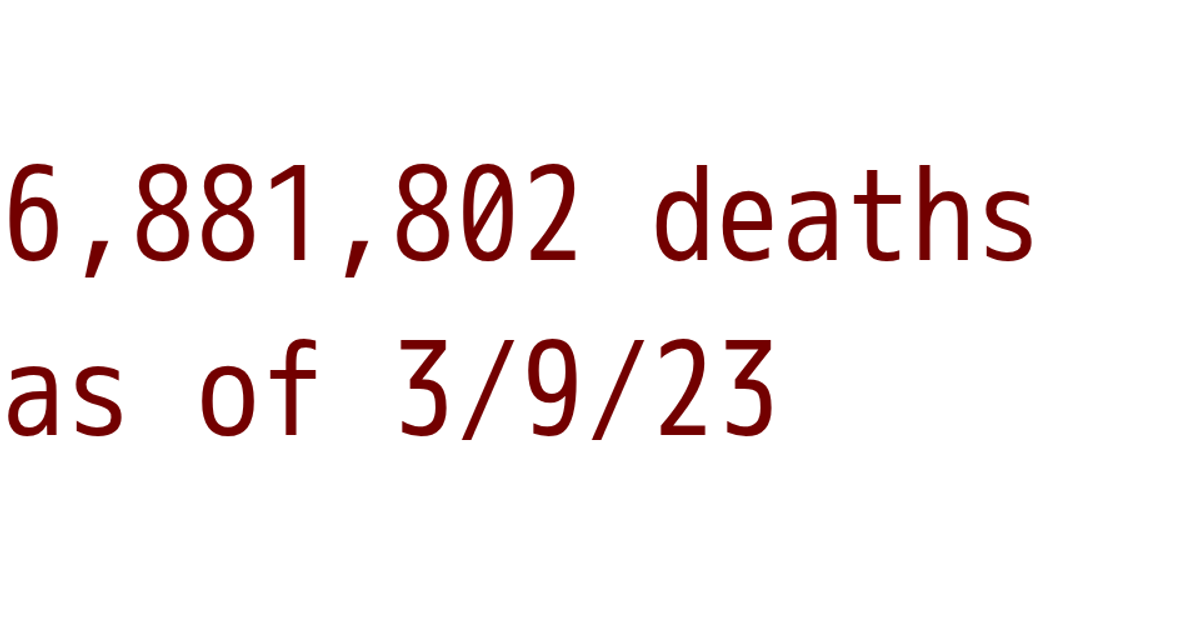
This visualization summarizes COVID-19 death data from the John Hopkins coronavirus dataset by displaying the total number of deaths and the latest date as large red text. It loads a CSV file with `d3.csv`, extracts the last date column, and sums all death values using `Array.reduce`. The result is formatted with `d3.format` and injected into an HTML `<pre>` element via `textContent`, updating the page with a single, stark numeric summary.
AI-generated descriptionThis program loads and parses the John Hopkins coronavis dataset;
MIT Licensed






Comments
Sign in to join the discussion.