🌍 Public
ICE 8 : Country Map
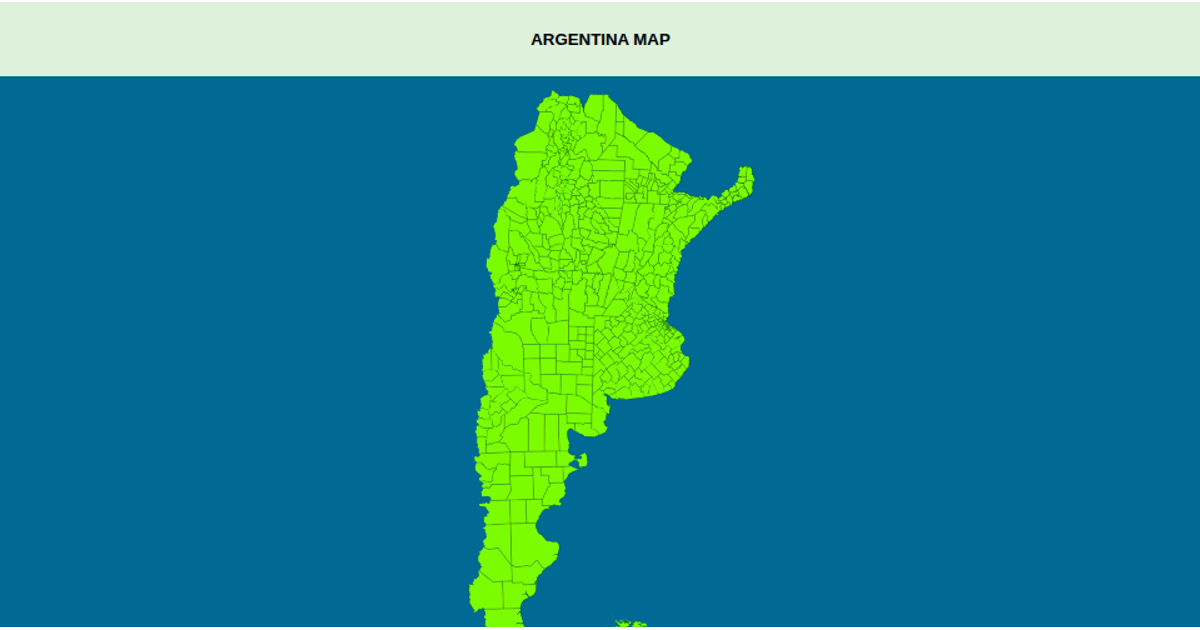
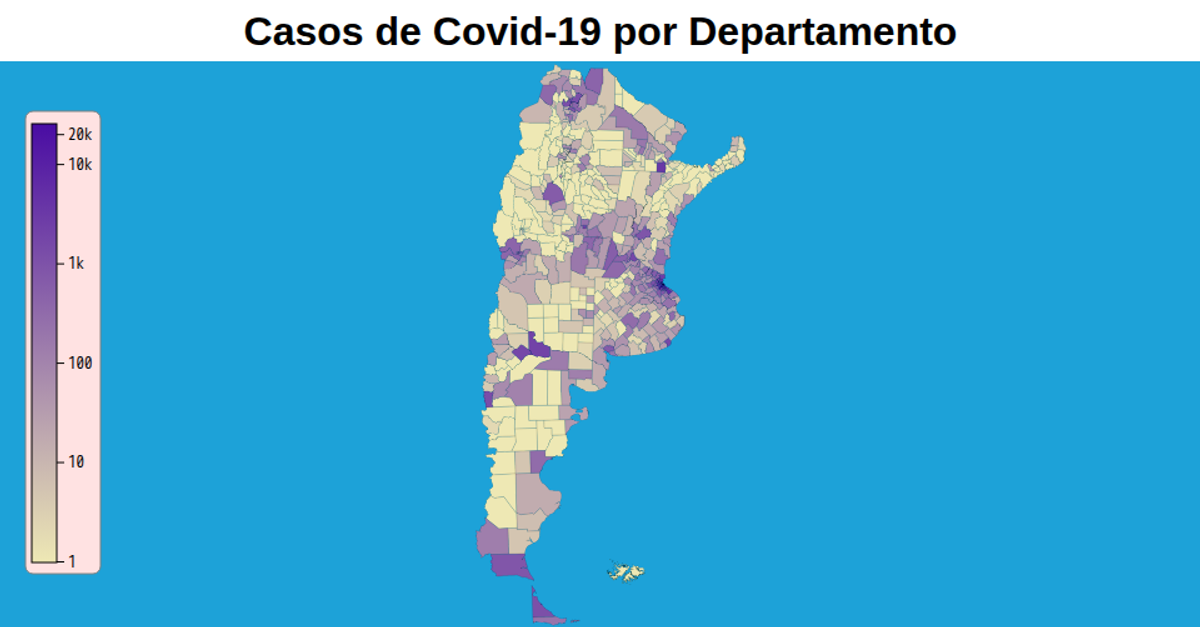
This example displays a map of Argentina’s administrative departments, colored by reported COVID-19 case counts. It uses a transverse Mercator projection via `d3.geoTransverseMercator` and renders geographic paths with `d3.geoPath`. A logarithmic color scale (`d3.scaleLog`) maps the case numbers to a teal fill. The map supports zooming through `d3.zoom`, and department shapes hover with a light blue highlight. Data is loaded as TopoJSON from a GitHub repository and drawn as SVG paths.
AI-generated descriptionMIT Licensed



Comments
Sign in to join the discussion.