🌍 Public
Fork of Title to the Dot (Studying of D3 Scatter Plot)
Zzhuomo-maker
Last edited Jun 22, 2023
Created on Jun 22, 2023
Forked from Title to the Dot (Studying of D3 Scatter Plot)
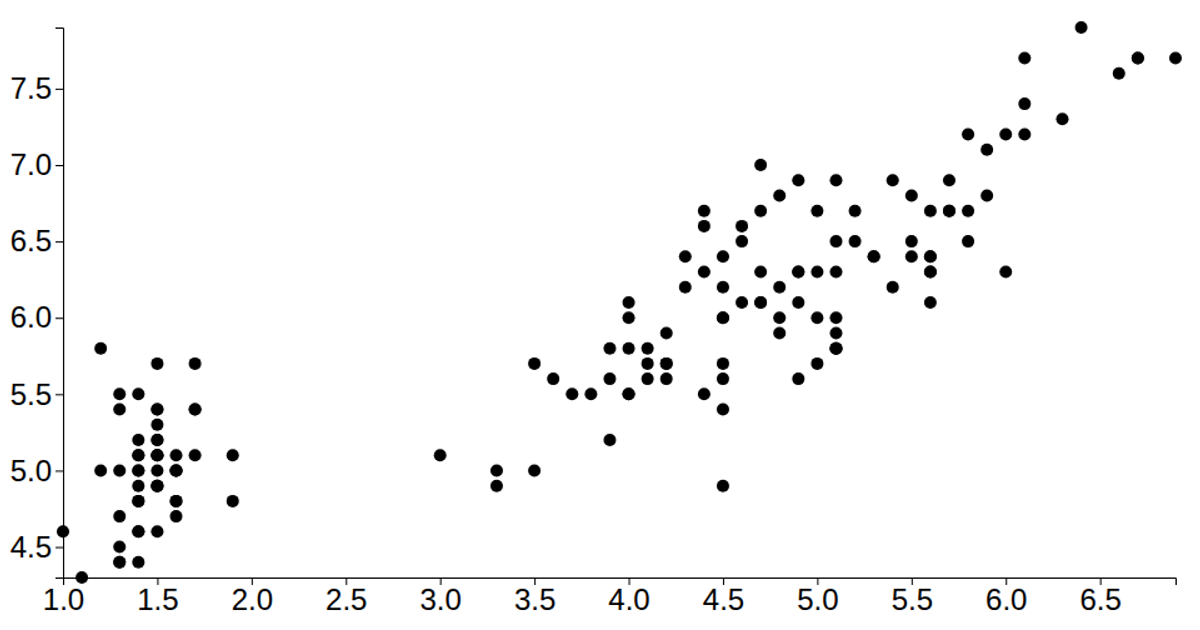
This scatter plot visualizes the Iris Dataset, mapping petal length against sepal length for individual flowers. The SVG rendering uses D3 v6 APIs including `csv`, `scaleLinear`, `extent`, `axisLeft`, and `axisBottom` to position circles and draw axes. Hovering over a circle reveals a tooltip with the exact data coordinates. The plot fills the browser window, with margins used for axis placement and tick labels styled at 24 pixels.
AI-generated descriptionA vanilla HTML implementation of a D3 scatter plot. Shows the Iris Dataset.
MIT Licensed



Comments
Sign in to join the discussion.