🌍 Public
Fork of Fork of Title to the Dot (Studying of D3 Scatter Plot)
NNatalia BM
Last edited Jan 21, 2026
Created on Jan 21, 2026
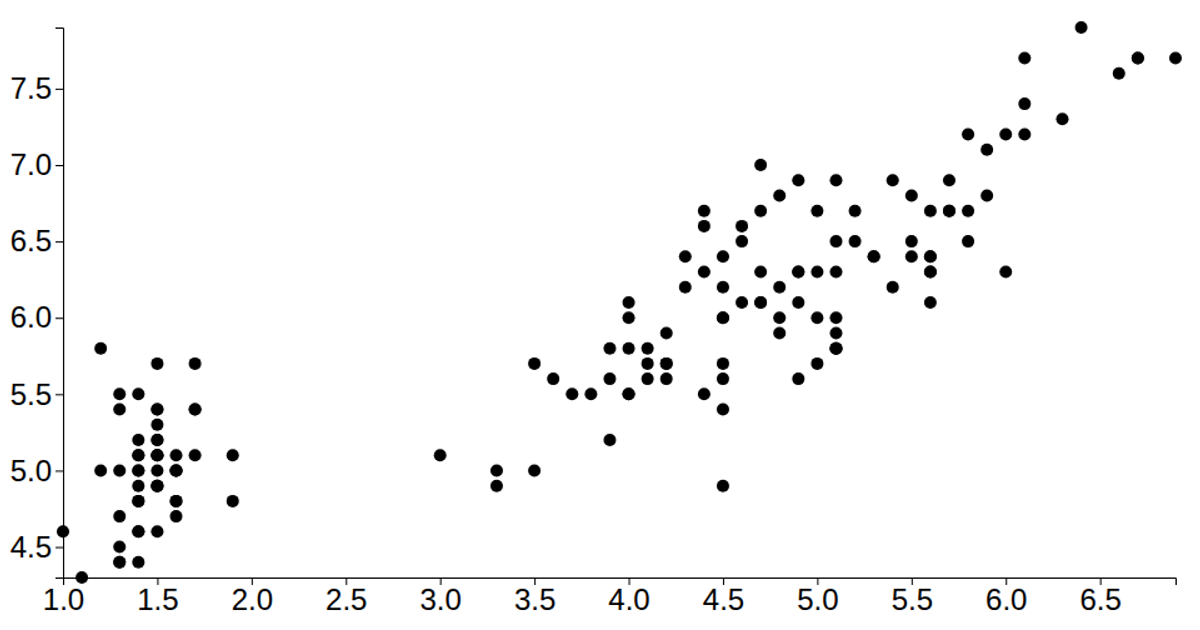
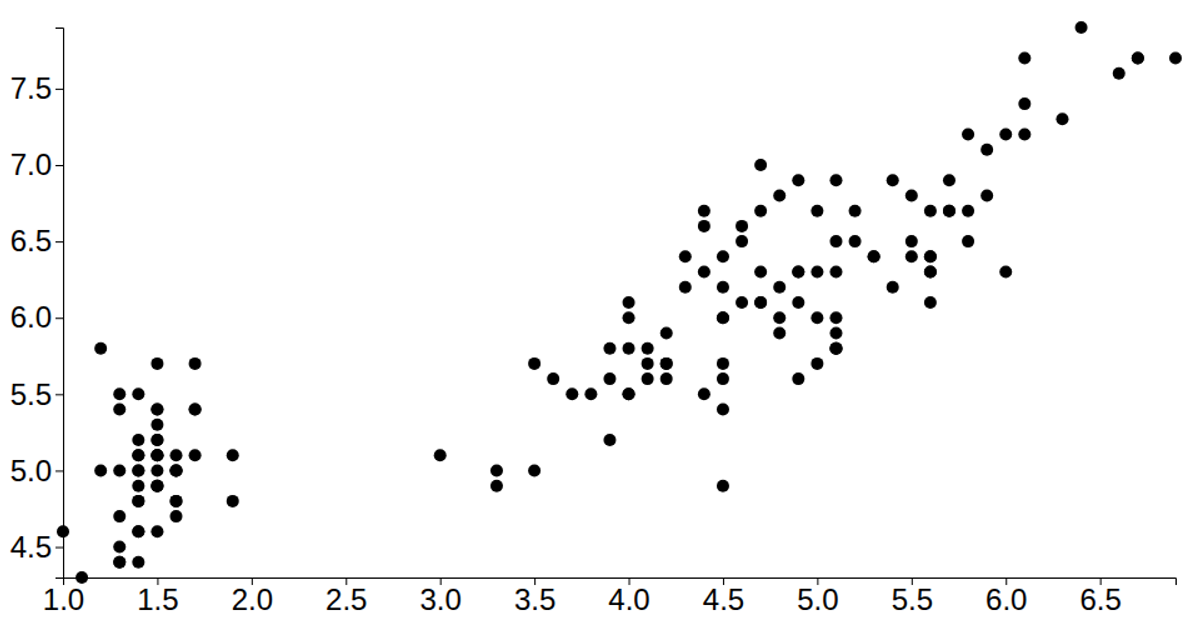
This example shows a scatter plot of the Iris dataset, mapping petal length on the x-axis against sepal length on the y-axis, with each point rendered as an SVG circle. It demonstrates a simple D3 data-join workflow: the code loads CSV data using `d3.csv`, parses numeric fields, and uses `d3.scaleLinear` with `d3.extent` to set the scales. Axes are drawn with `d3.axisLeft` and `d3.axisBottom`, while `d3.select` and `.append` build the SVG elements. Hovering over a point reveals a tooltip with the coordinate pair via an SVG `title` element.
AI-generated descriptionMIT Licensed




Comments
Sign in to join the discussion.