🌍 Public
Choropleth map
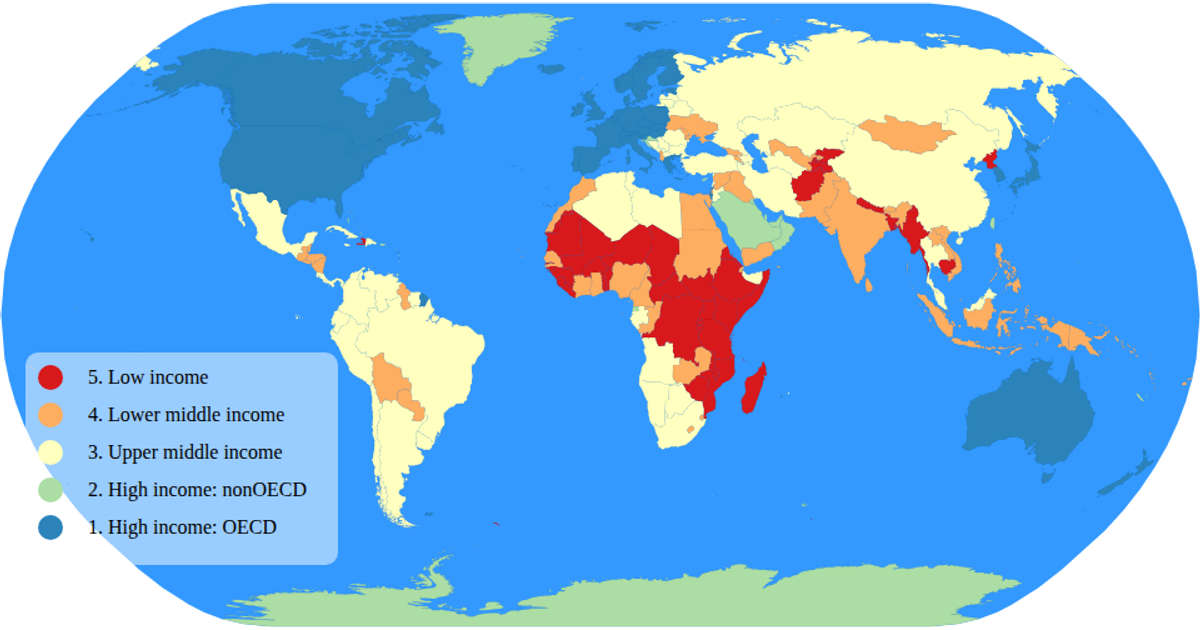
This example displays a choropleth map of the world, coloring each country according to its income group using a categorical color scale. The visualization loads geographic data from the World Atlas TopoJSON and TSV files, projecting it with `d3.geoNaturalEarth1` and rendering paths via `d3.geoPath`. A custom legend component uses D3 selections to show color categories. The map supports zoom and pan through `d3.zoom`, and hovering over a country highlights it in red while a tooltip reveals its name and income group.
AI-generated descriptionAn example showing the capabilities of VizHub.
MIT Licensed



Comments
Sign in to join the discussion.