🌍 Public
Choropleth Map
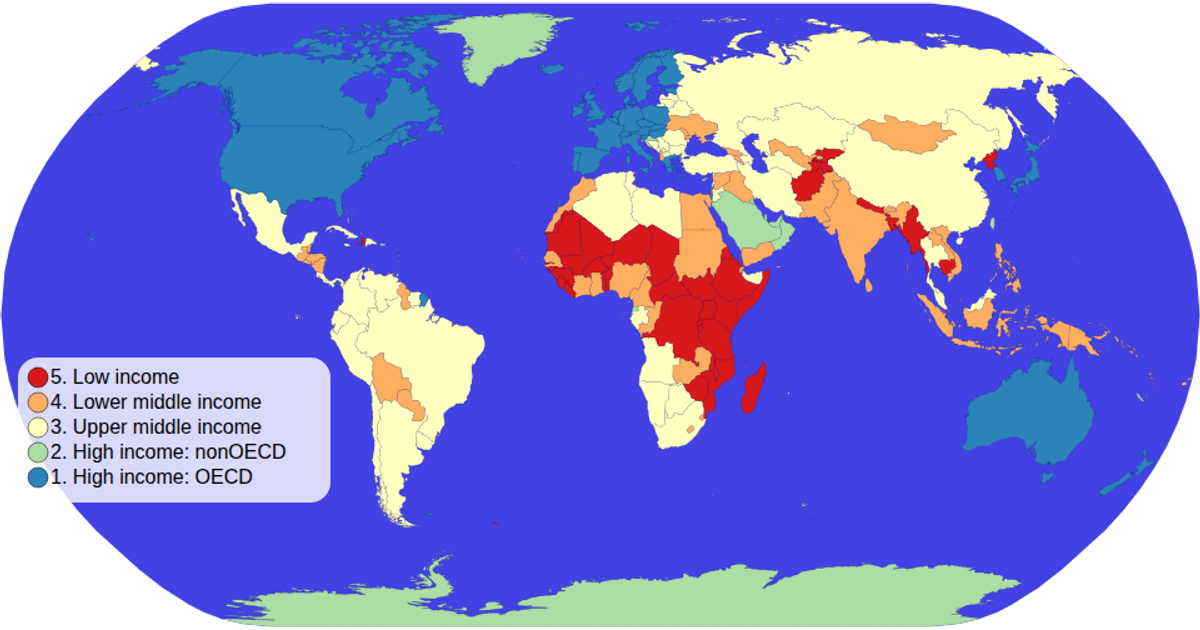
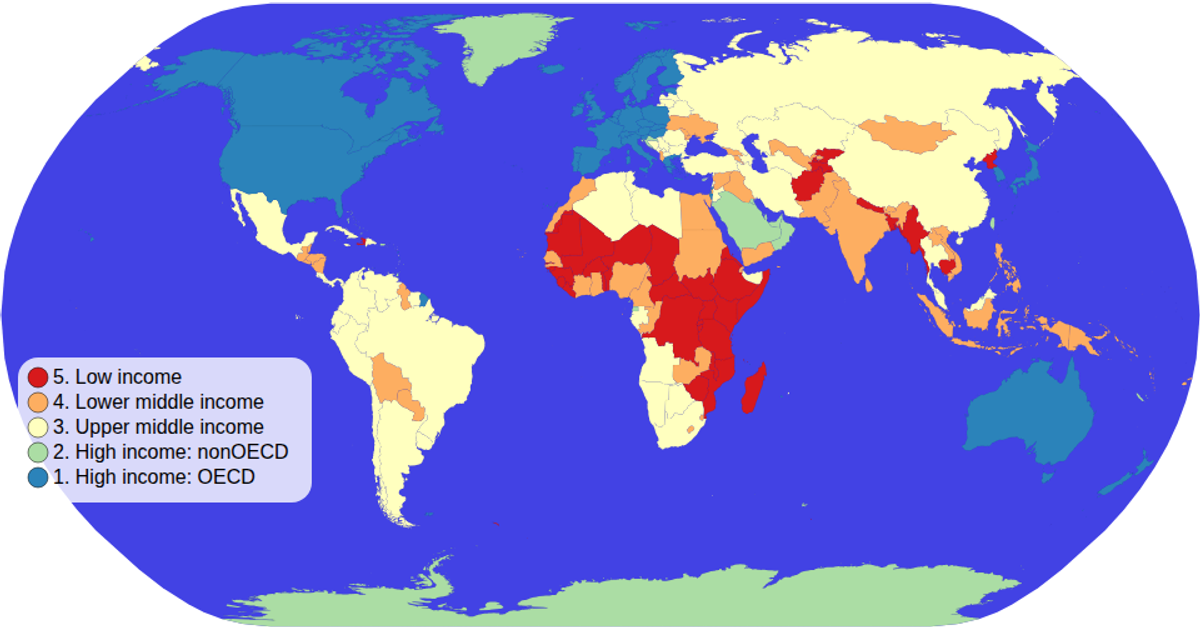
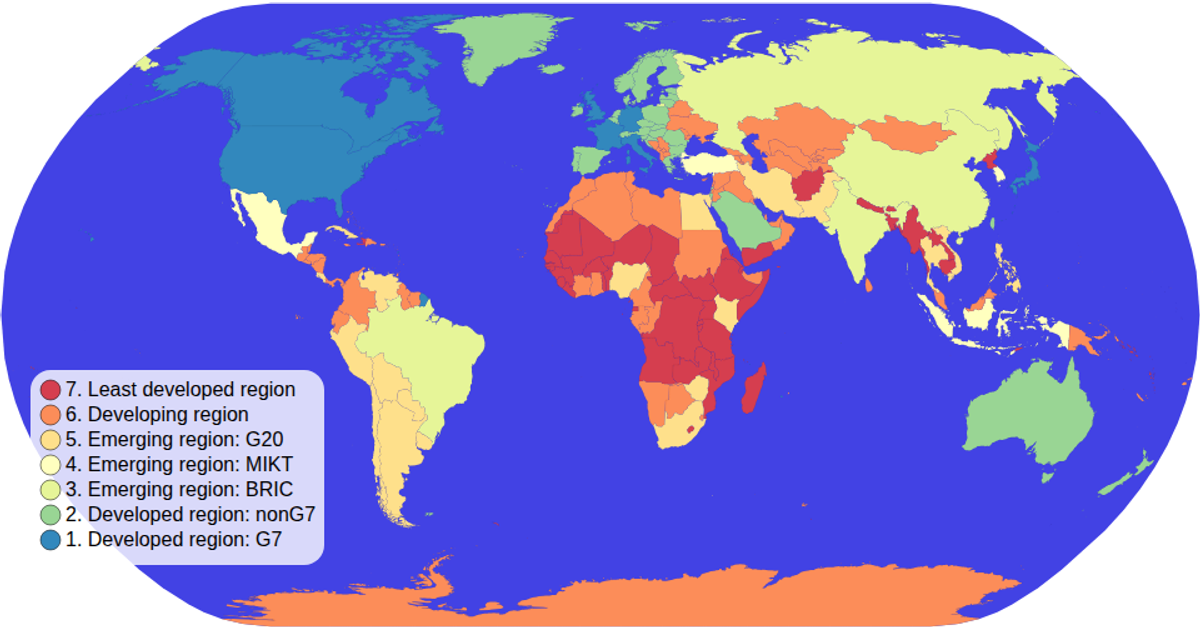
This example displays a world map as a choropleth, with each country colored by its income group using an ordinal color scale and a custom SVG legend. D3’s `geoNaturalEarth1` projection and `geoPath` render geographic boundaries from a TopoJSON source, while data from a TSV file is joined by country ID. Hovering a country turns it red and shows its name and income group in a tooltip, and pan/zoom interaction is enabled via a custom zoom event.
AI-generated descriptionMIT Licensed



Comments
Sign in to join the discussion.