🌍 Public
Revenue by Passenger Class
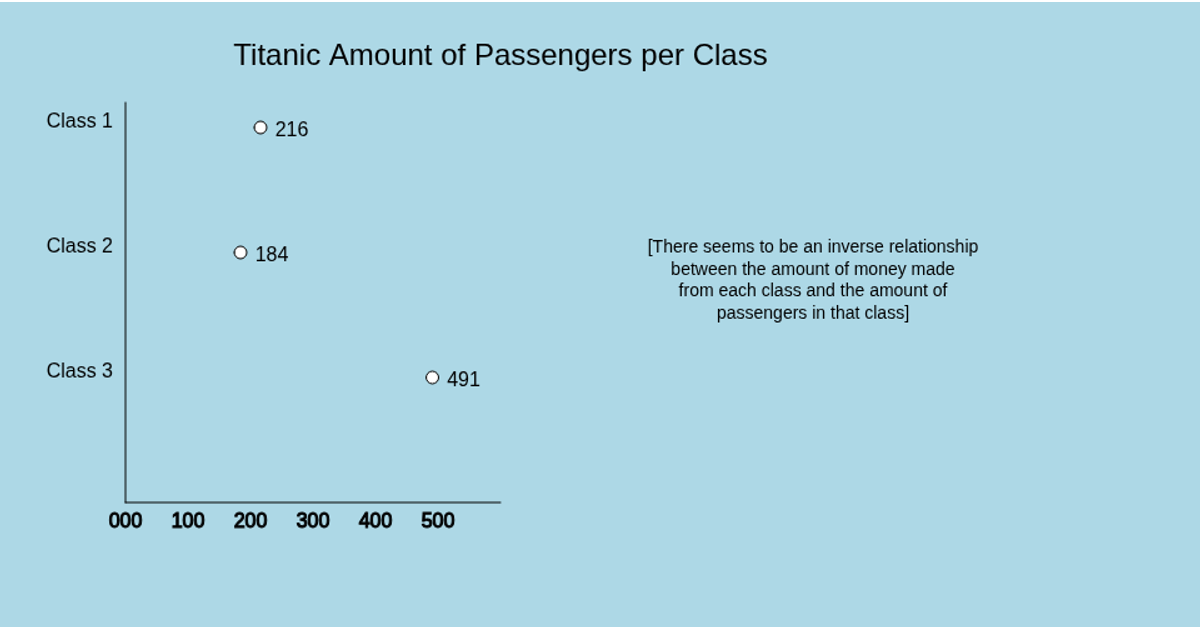
This visualization shows the total revenue collected from each passenger class on the Titanic, aggregated from a CSV dataset loaded via `loadTable`. The p5.js `draw()` function iterates through every row, summing the `Fare` values per `Pclass` and mapping the totals to horizontally scaled rectangles. Revenue amounts are labeled at the end of each bar, with an x-axis manually marked in increments of 1000 from 0 to 5000. The chart uses the Canvas API through p5.js's `rect` and `text` functions, and the axis lines are drawn with p5.js’s `line` method.
AI-generated descriptionA bare minimum HTML page demonstrating use of CSS and JavaScript.
See also React Starter.
MIT Licensed




Comments
Sign in to join the discussion.