🌍 Public
A2 - Revenue by Class [Bar Chart]
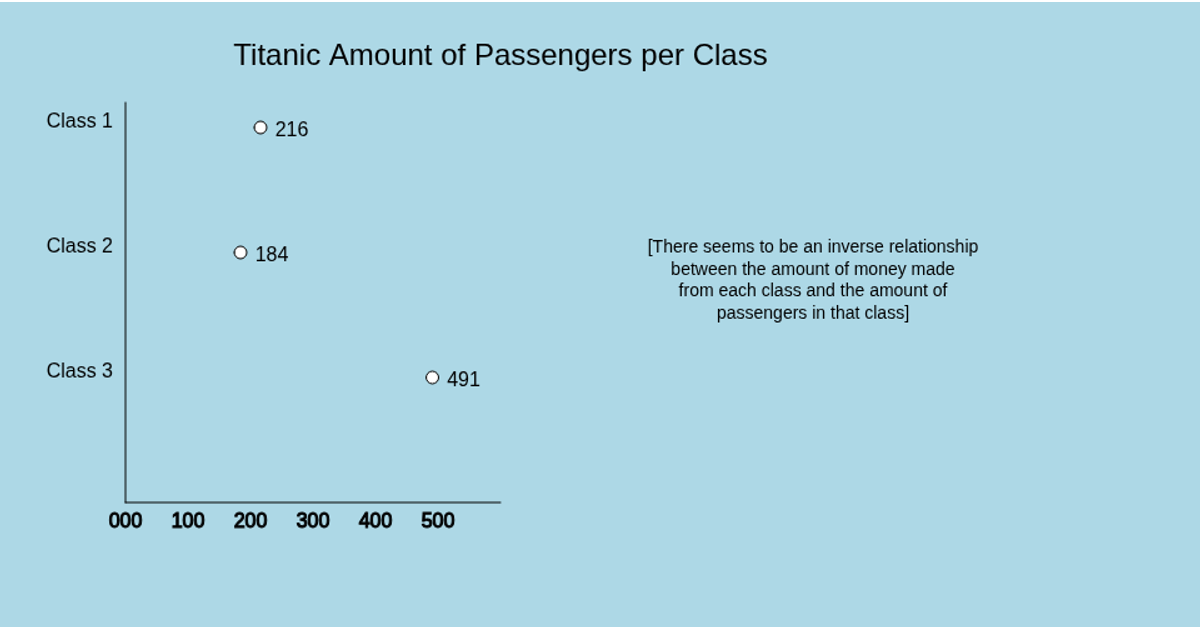
This bar chart displays the total revenue collected from each passenger class on the Titanic, using a simple p5.js sketch. It draws three horizontal bars that show the sum of all fares paid by first, second, and third class passengers, with each bar labeled and accompanied by its total fare value. The visualization highlights the surprising finding that second class generated the least revenue. The data is loaded from a remote CSV file using p5.js’s `loadTable` and rendered on a canvas with basic shapes.
AI-generated descriptionA bare minimum HTML page demonstrating use of CSS and JavaScript.
See also React Starter.
MIT Licensed




Comments
Sign in to join the discussion.