🌍 Public
A2 - Passengers per Class (Dot Plot)
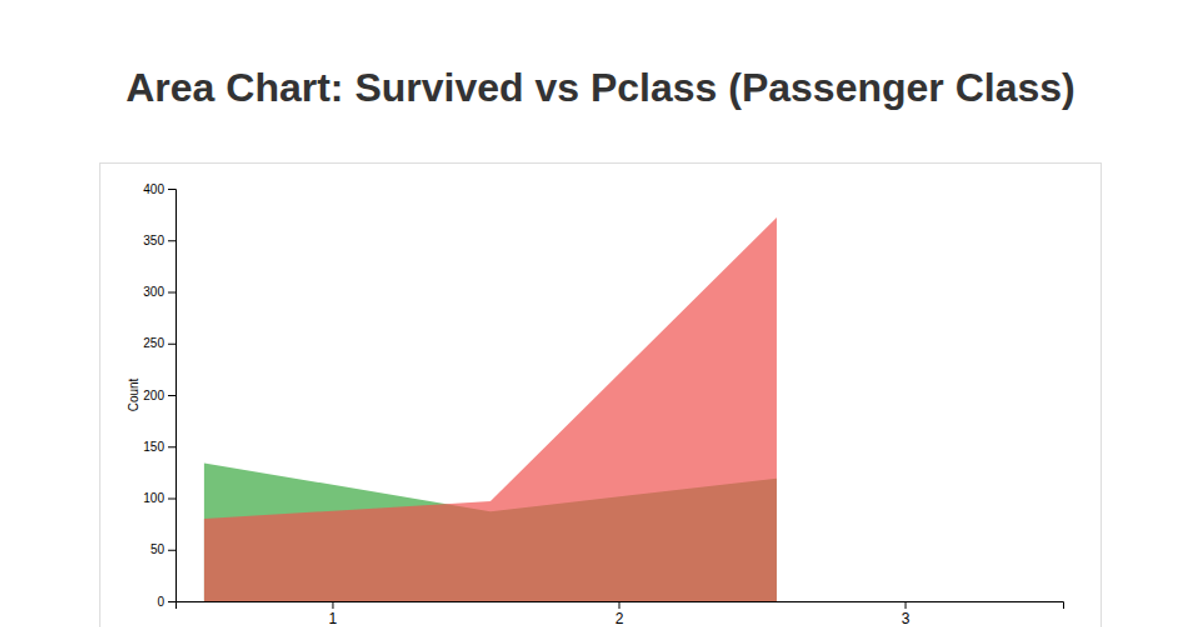
This dot plot visualizes the number of Titanic passengers per class using p5.js, with CSV data loaded via the `loadTable` function from a GitHub gist. The sketch counts passenger records by class and renders three circles with labels, revealing an inverse relationship between class affluence and passenger count. A light blue background, axis lines, and annotations highlight the trend. The visualization displays passenger counts (Class 1: 216, Class 2: 184, Class 3: 491) on a canvas sized to the window, with axes labeled from 0 to 300 in increments of 100.
AI-generated descriptionA bare minimum HTML page demonstrating use of CSS and JavaScript.
See also React Starter.
MIT Licensed


Comments
Sign in to join the discussion.