🌍 Public
HAW Tidy Tuesday Music (Matthias)
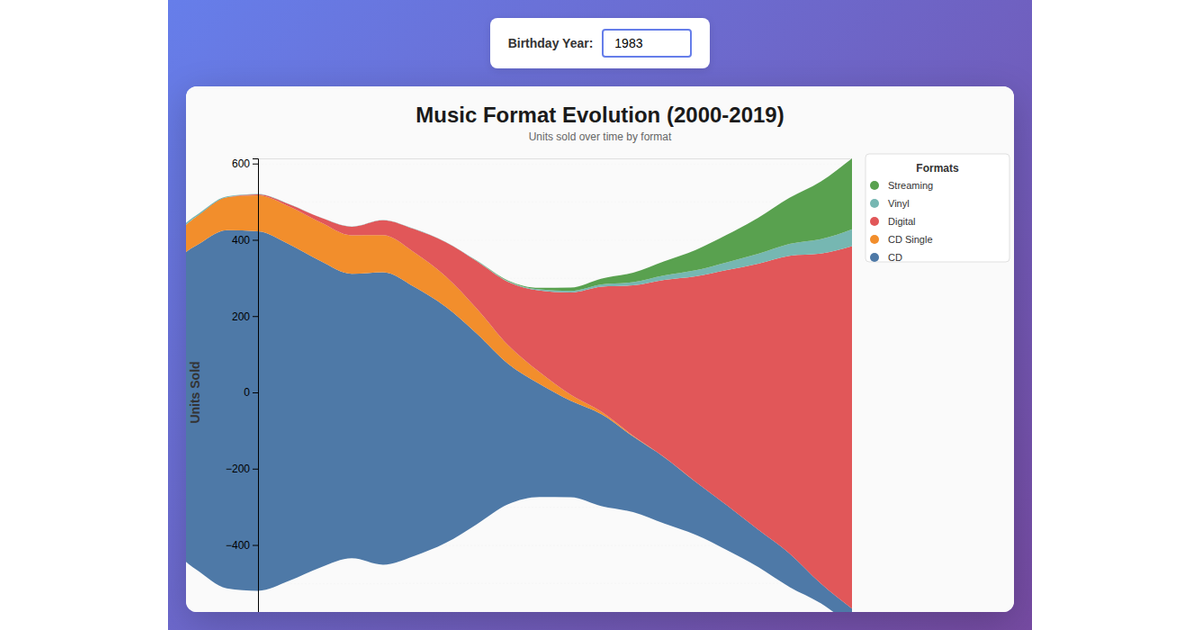
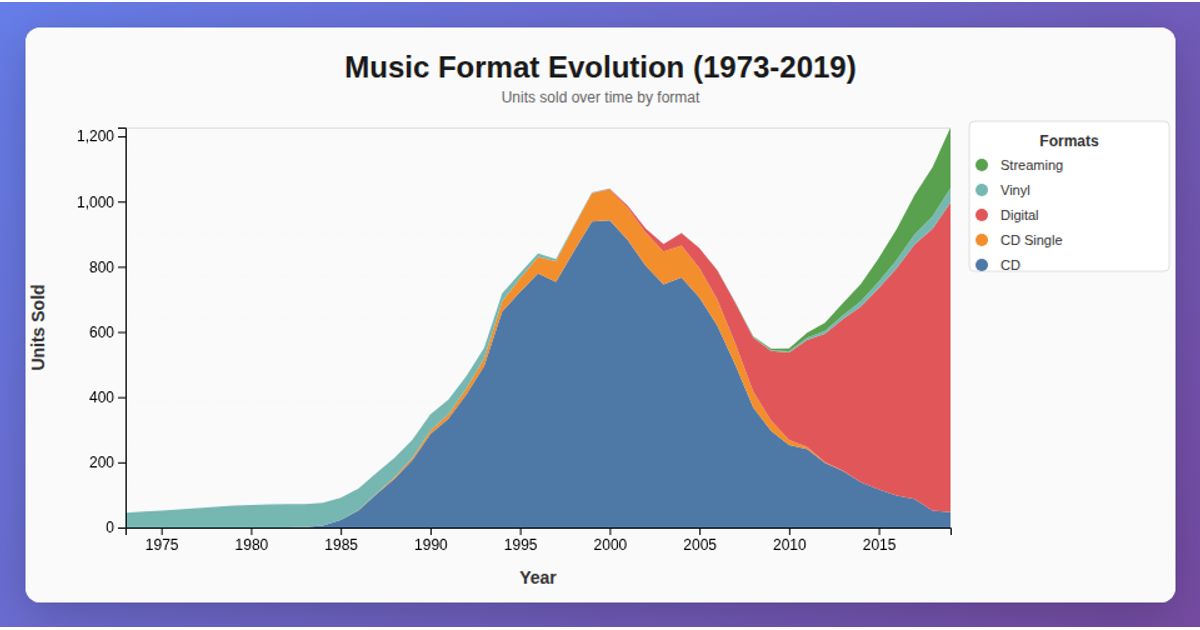
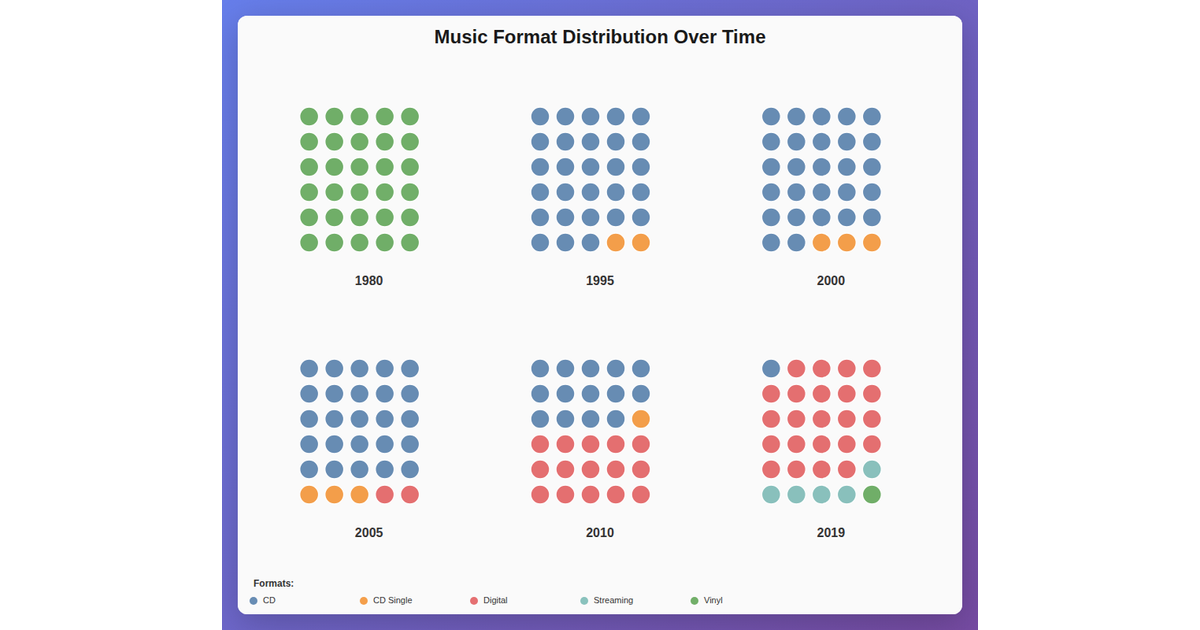
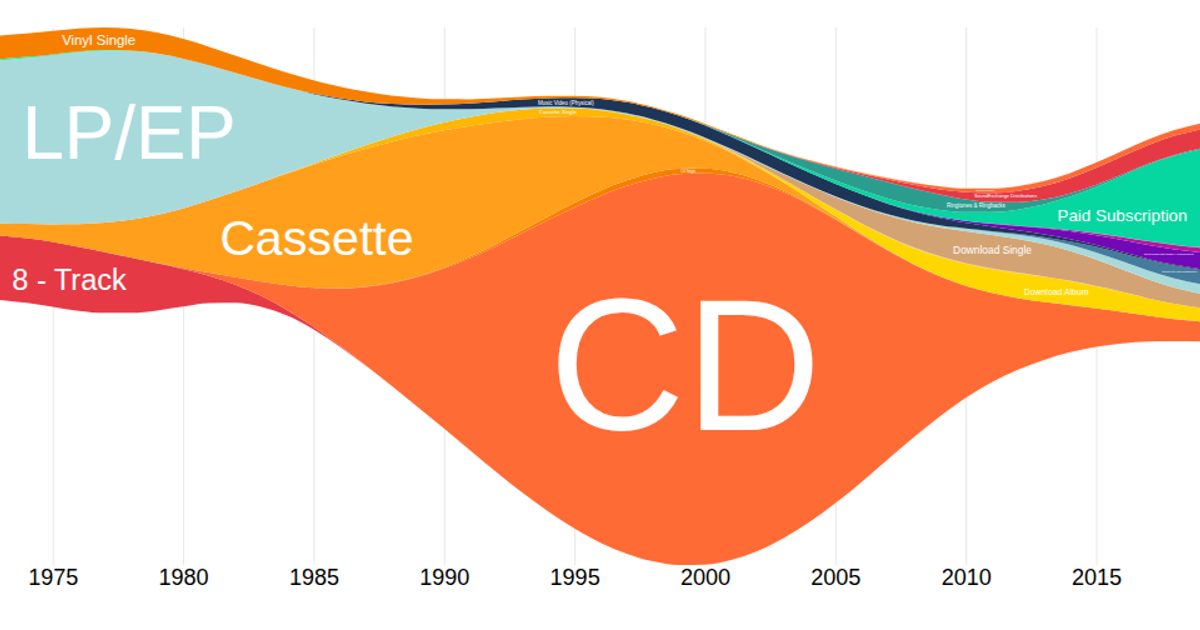
This visualization shows the rise and fall of music format sales from 1973 to 2019, comparing CD and CD Single units sold in millions. Two colored lines trace annual sales across the chart, with a legend identifying each format. The code uses D3’s `scaleLinear`, `area`, `line`, and `ordinal` scales with `schemeCategory10` for colors. The `@curran/responsive-axes` library renders the axes. Data comes from embedded CSV text parsed with semicolon separators, grouped by format.
AI-generated descriptionMIT Licensed



Comments
Sign in to join the discussion.