🌍 Public
Fork of music streaming
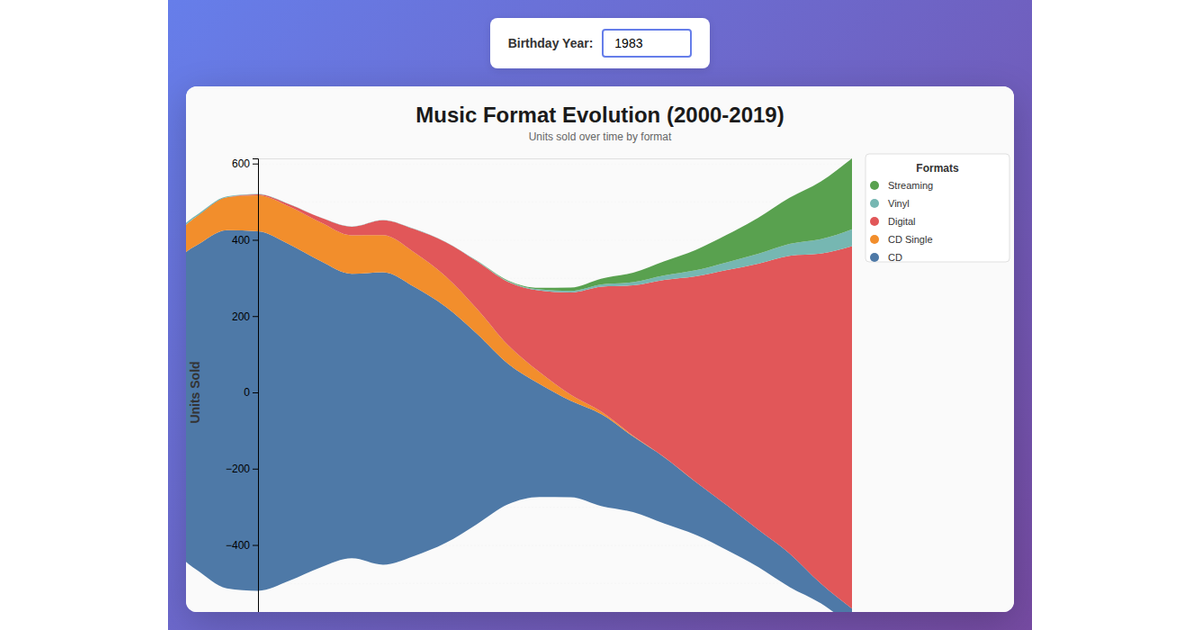
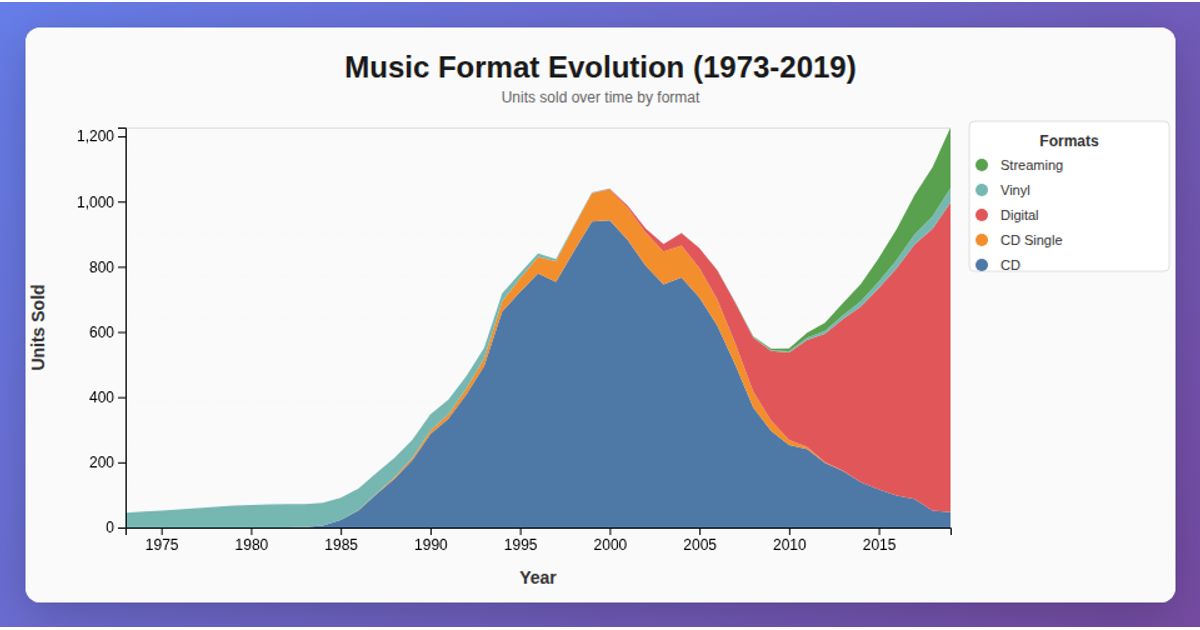
Six small multiples compare the popularity of music formats (CD, CD Single, Digital, Vinyl, Streaming) for selected years from 1980 to 2019, where each chart is a 6x5 grid of circles colored by format. Using React and D3 v7, the visualization transforms semicolon-delimited CSV data into pictograms, with animated circle growth, hover highlighting, and tooltips. The D3 scaleOrdinal and schemeTableau10 assign colors, while a join operation renders the circle glyphs.
AI-generated descriptionMIT Licensed




Comments
Sign in to join the discussion.