🌍 Public
Fork of music streaming (Matthias)
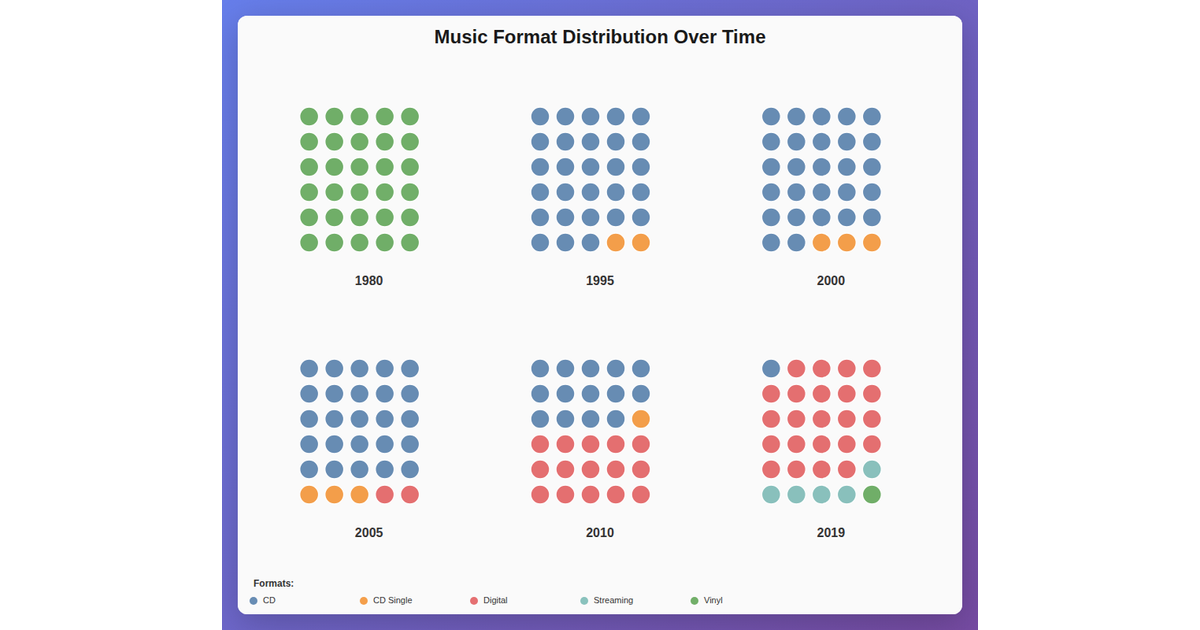
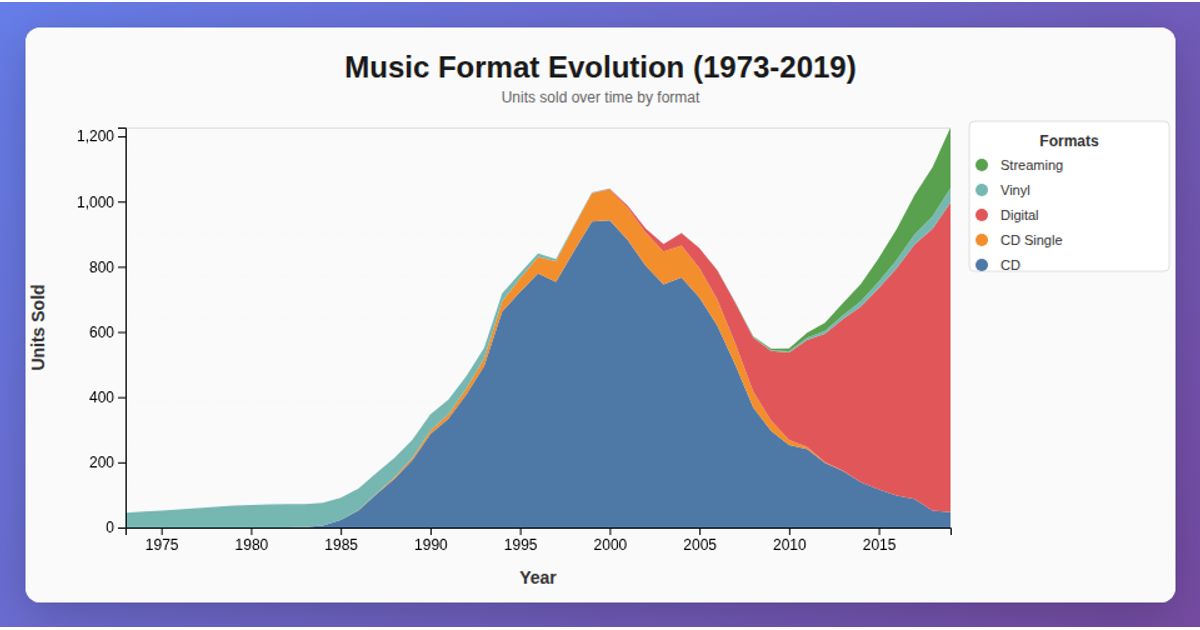
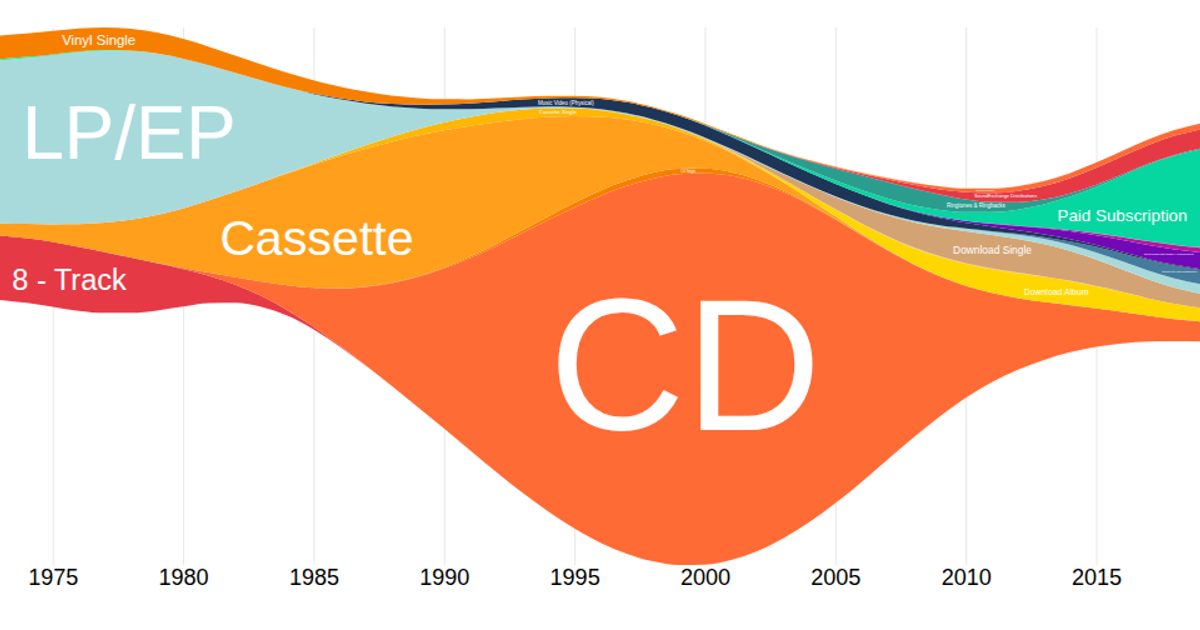
This interactive visualization displays music format sales trends from 2000 to 2019, showing how CD, vinyl, digital, and streaming revenues evolve over time. A streamgraph, built with d3.stack and stackOffsetSilhouette, centers the data vertically, with smooth areas colored via scaleOrdinal and schemeTableau10. Users adjust a birthday year input to place a red marker line, while hover effects highlight individual format layers. The chart loads semicolon-delimited CSV data in React, parses European decimal commas, and renders animated SVG areas with d3.area and curveMonotoneX.
AI-generated descriptionMIT Licensed



Comments
Sign in to join the discussion.