🌍 Public
Armadillo demo
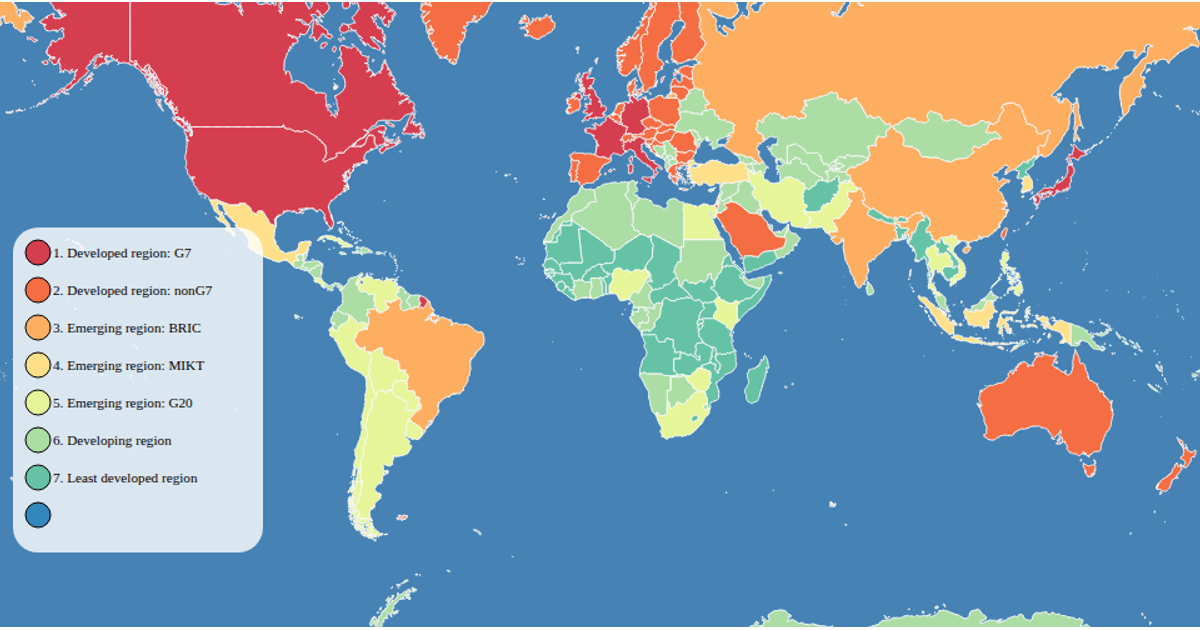
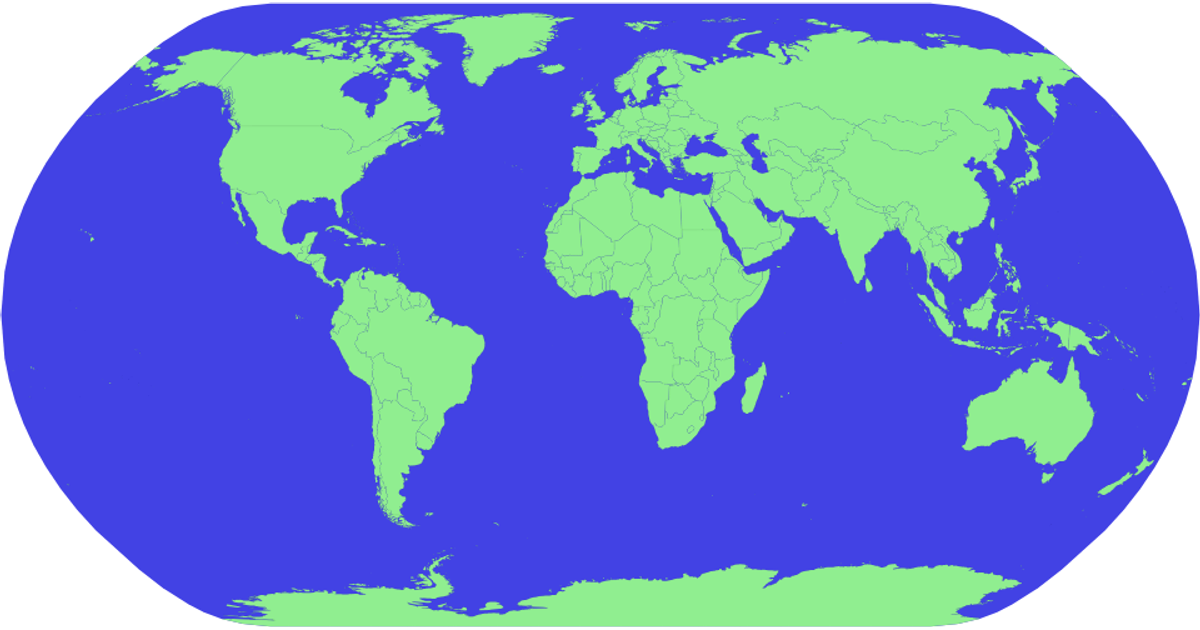
This example visualizes global mobile data prices by coloring countries on a Miller projection map, with green indicating available pricing data and grey for missing values. Hovering a country reveals a tooltip with its name, price in USD per MB, and demo notes for calling and SMS. The visualization uses d3.geoPath with the geoMiller projection from d3-geo-projection, loads geographic features and pricing data via Promise.all, and supports pan/zoom through d3.zoom. Country fill colors are assigned from parsed CSV data, with hover effects increasing opacity and stroke width.
AI-generated descriptionArmadillo demo
MIT Licensed




Comments
Sign in to join the discussion.