🌍 Public
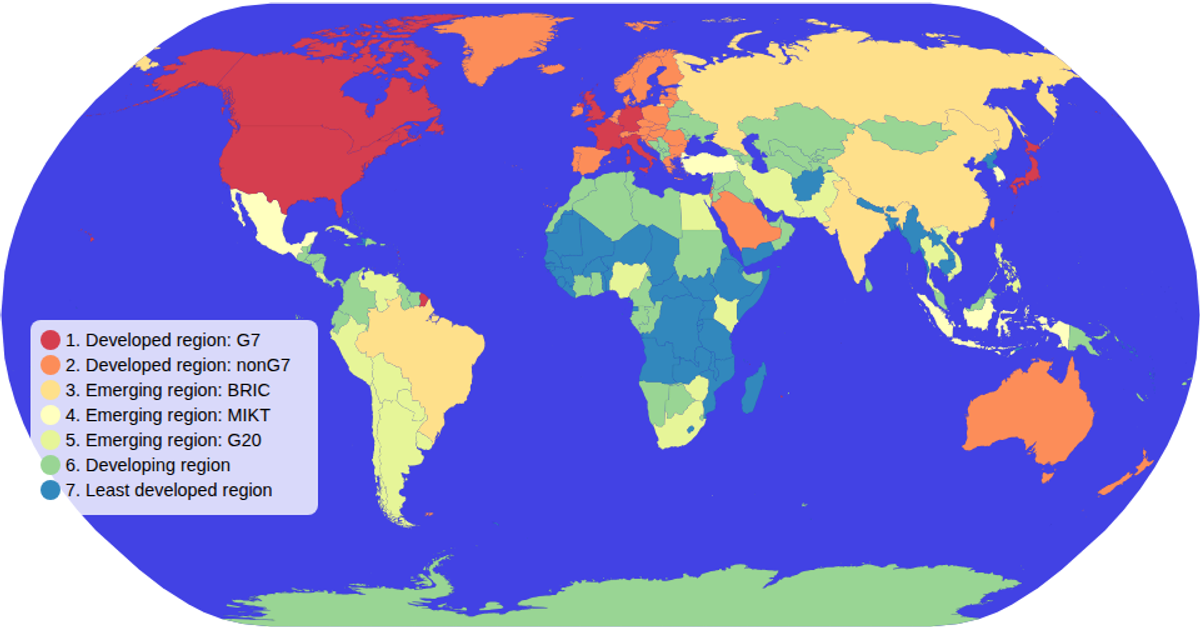
(interactive) Choropleth Map
This interactive choropleth map visualizes global economic data across countries using a spectral color scale. The map supports zooming and panning via d3.zoom, with a clickable color legend that highlights matching countries and dims others. Built with d3-geoPath and a Mercator projection, it renders SVG paths from TopoJSON data sourced from the world-atlas dataset. The legend uses d3.scaleOrdinal and d3.schemeSpectral to map categorical values to colors, with opacity transitions indicating selection state.
AI-generated descriptionMIT Licensed


Comments
Sign in to join the discussion.