🌍 Public
Choropleth map with interaction
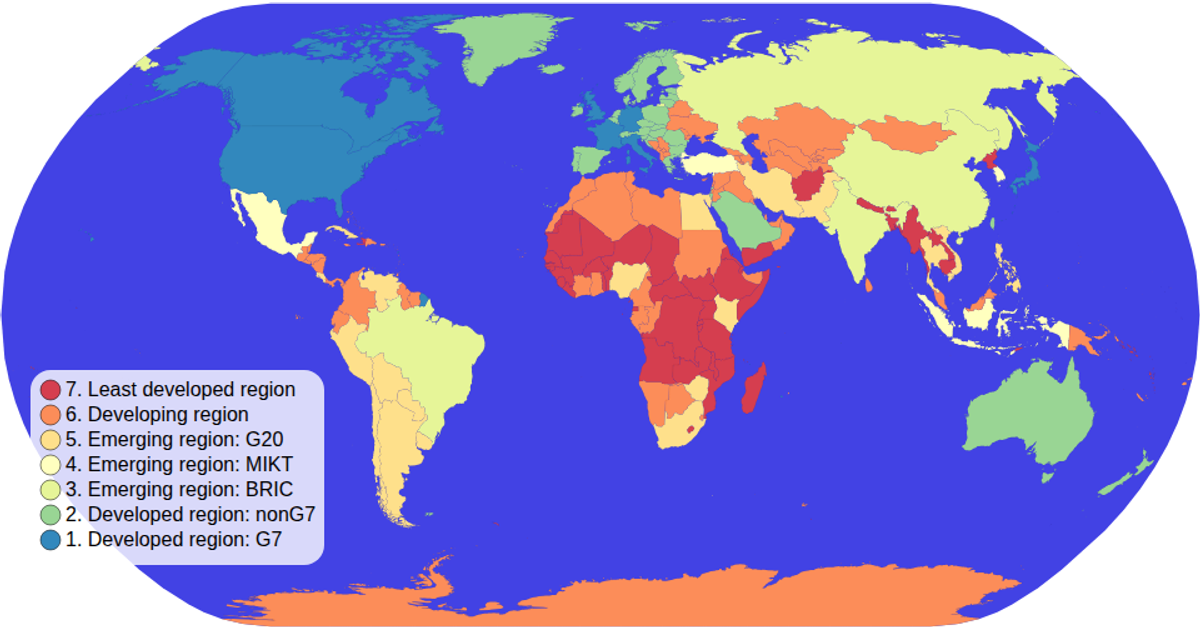
This choropleth map displays global economic data, with each country colored according to its economy category. Clicking a color legend item filters the map, dimming non-matching countries and highlighting the selected category; clicking again clears the filter. The visualization uses d3.geoPath with a geoNaturalEarth1 projection to render country shapes from TopoJSON data, while d3.scaleOrdinal and schemeSpectral define the color encoding. d3.zoom enables panning and zooming, and the color legend uses d3 selections with click handlers for interaction.
AI-generated descriptionDemonstrates fundamental DOM manipulation using D3.js by making a smiley face whose eyebrows move.
MIT Licensed




Comments
Sign in to join the discussion.