🌍 Public
Hello games
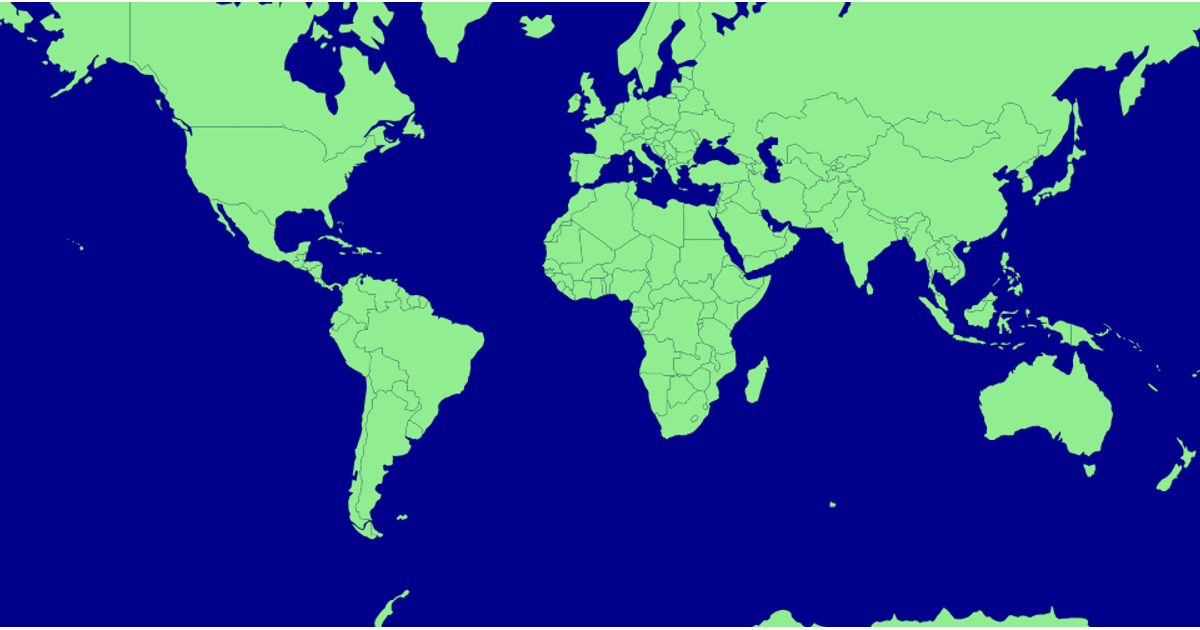
This example displays a world map where countries are colored green or grey based on data from a CSV file of Armadillo game prices, accessed via a gist URL. Using D3 v6, it renders paths with `d3.geoPath` and a Miller projection, then updates fill colors by matching country names against parsed CSV values. The map includes interactive tooltips and hover effects, while the code also demonstrates `d3.json` and `d3.csv` for loading multiple data sources.
AI-generated descriptionGames to Vizhub
MIT Licensed





Comments
Sign in to join the discussion.