🌍 Public
2019 Ridgecrest Earthquakes
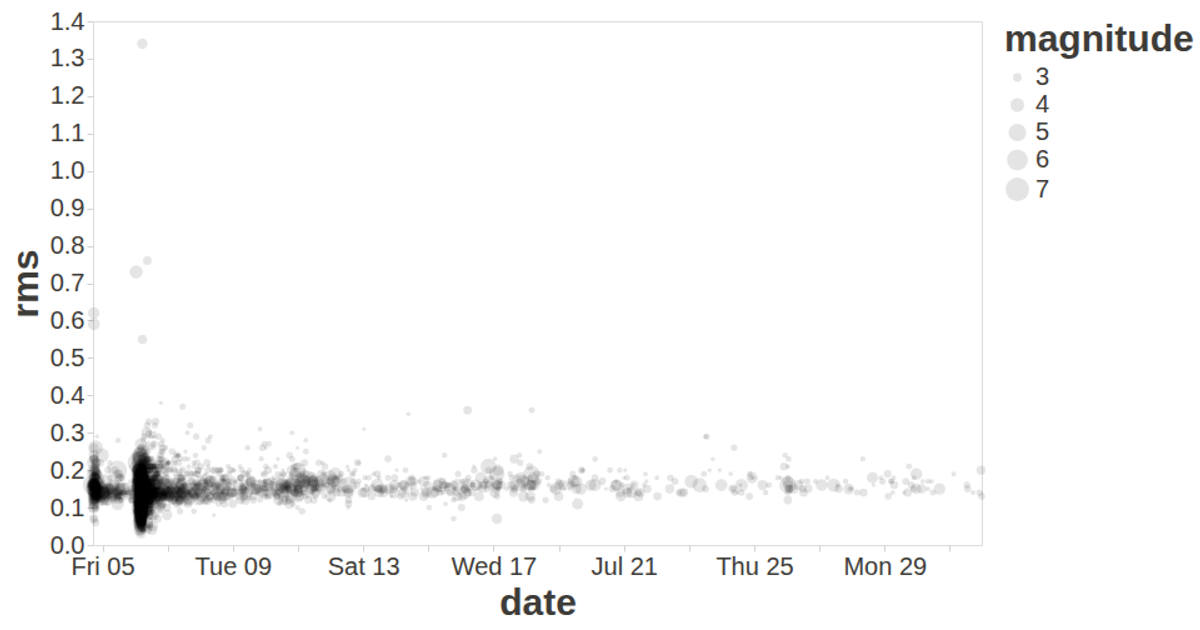
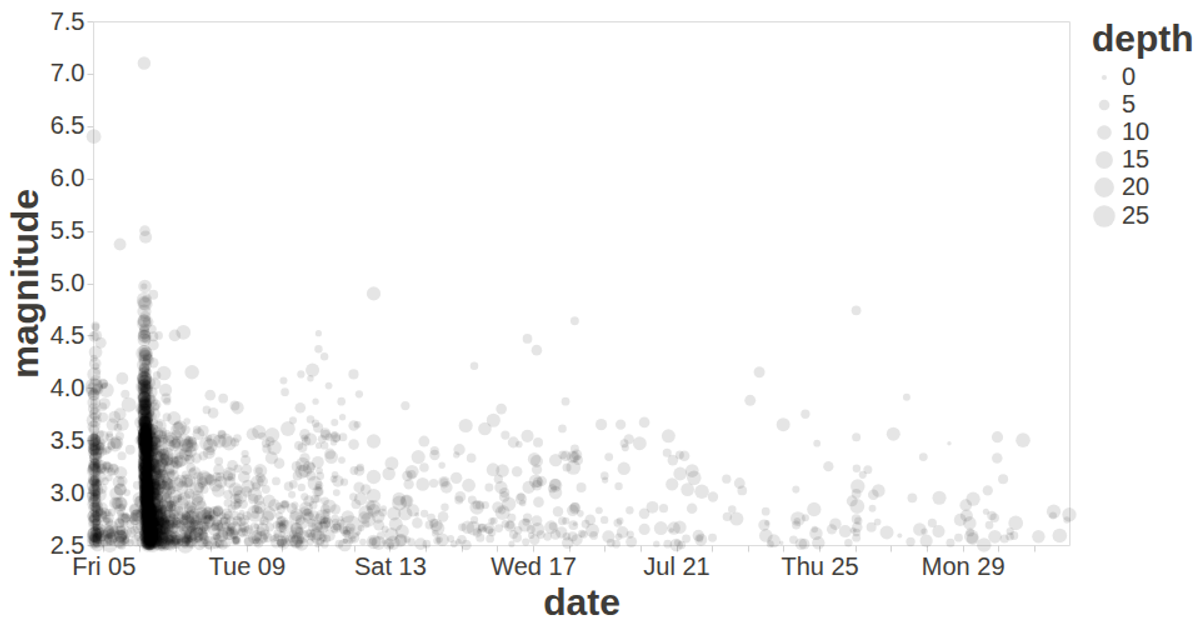
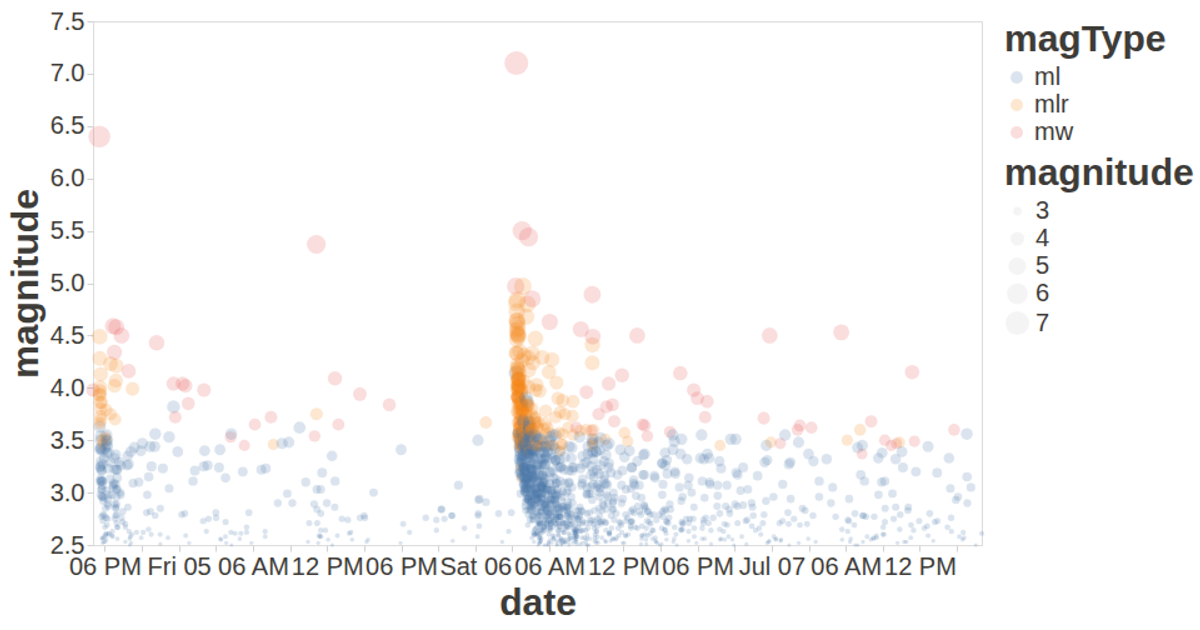
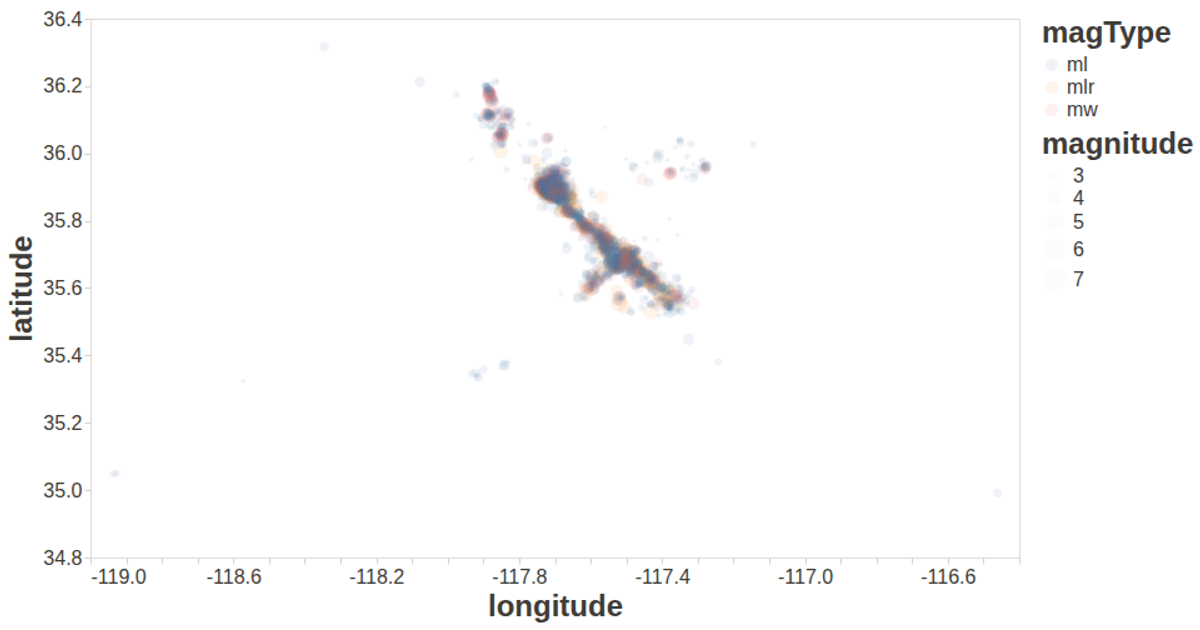
A scatterplot visualizes over a year of earthquakes in Ridgecrest, California, with time on the x-axis, depth on the y-axis, and point size encoding magnitude. The visualization uses the vega-lite-api to build the chart, which is rendered with vega and vega-lite, while d3.csv loads the data. Points are semi-transparent to show density, and tooltips display date, magnitude, and depth details.
AI-generated descriptionA visualization constructed using the vega-lite-api.
MIT Licensed




Comments
Sign in to join the discussion.