🌍 Public
2019 Ridgecrest Earthquakes
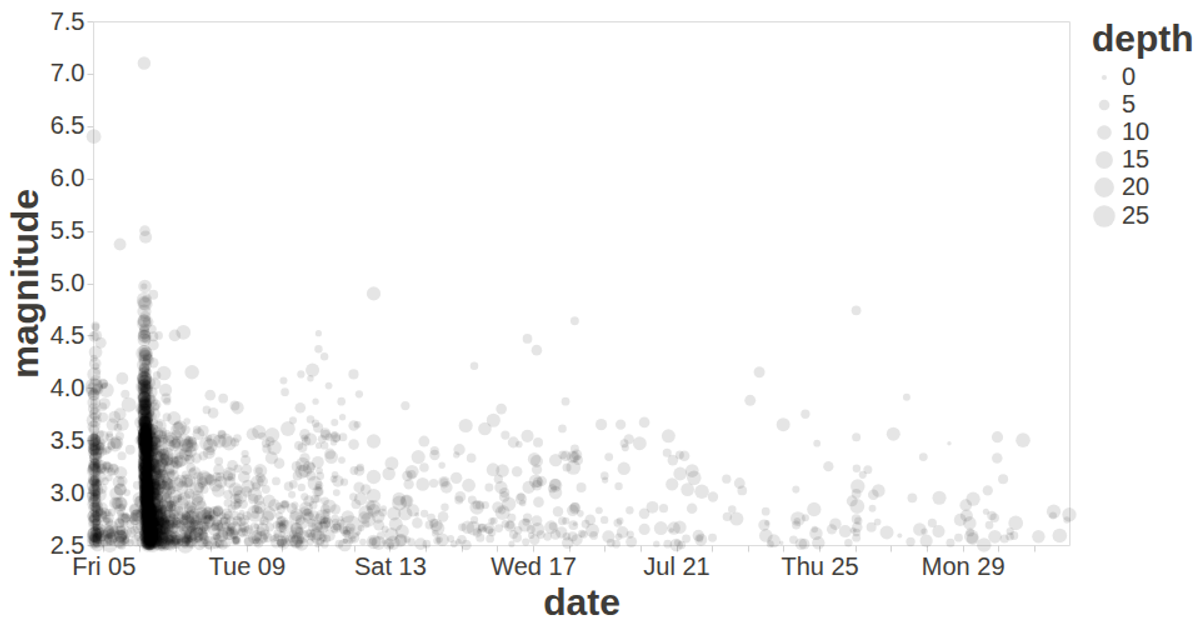
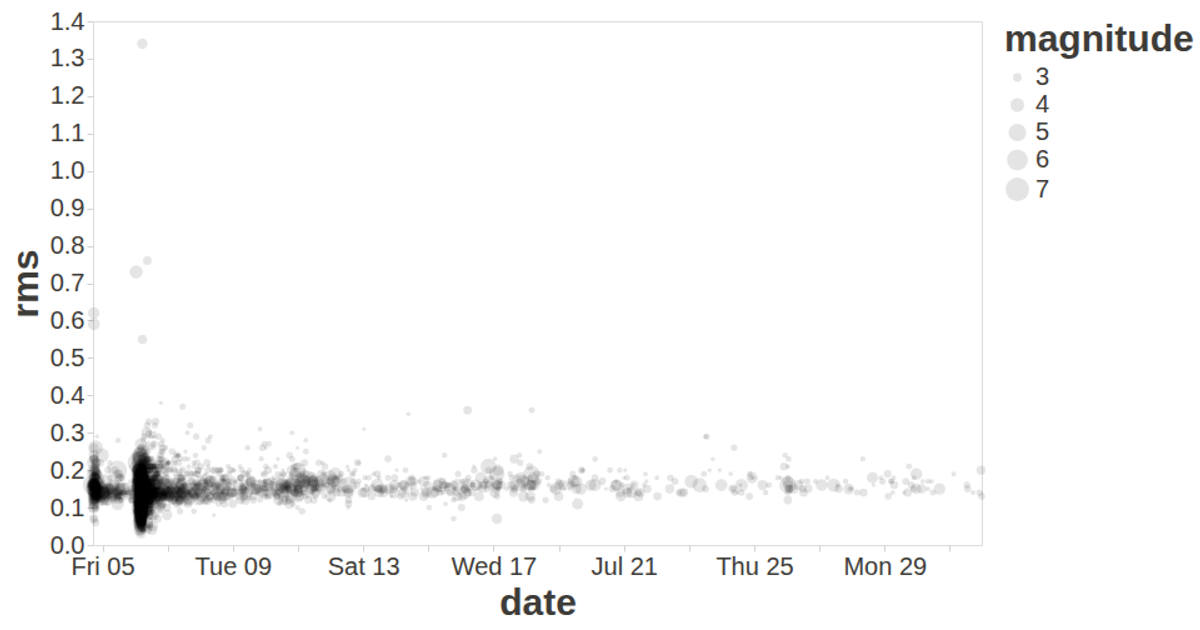
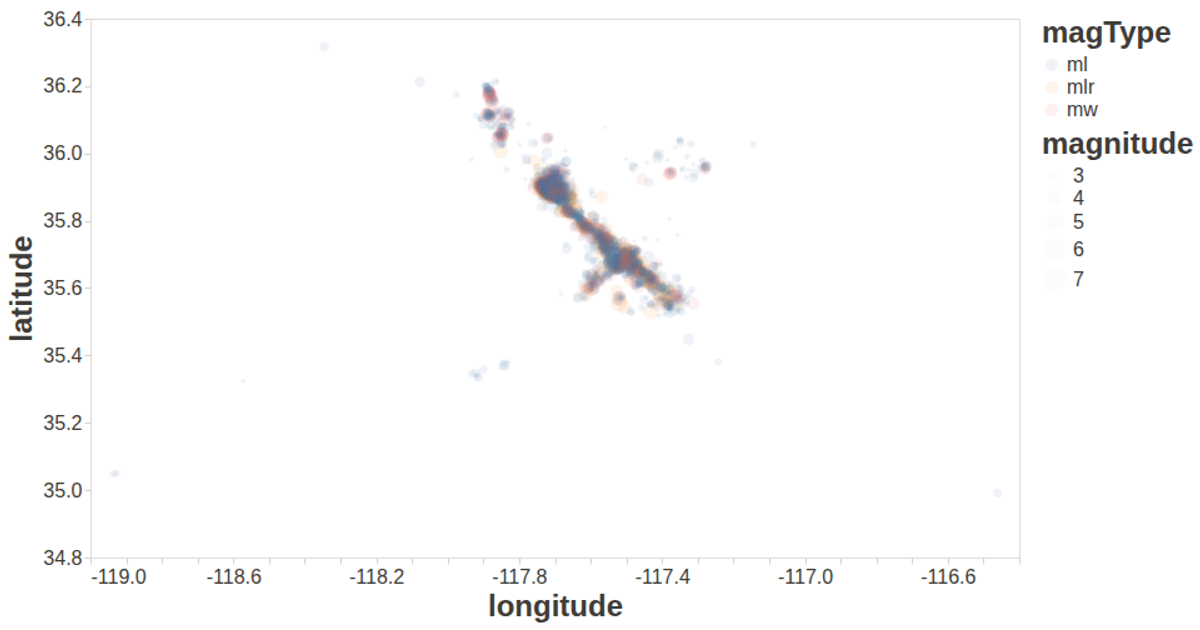
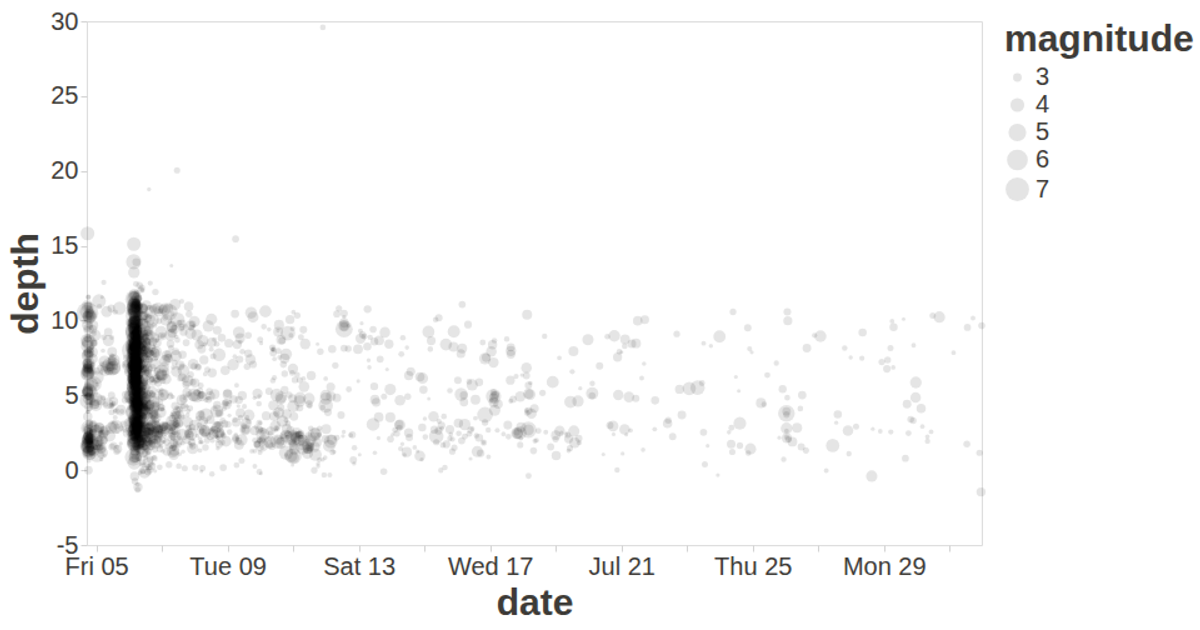
This visualization plots over 1,500 earthquakes from the 2019 Ridgecrest sequence, showing magnitude on the x-axis versus depth on the y-axis. Each semitransparent black circle represents one quake, with tooltips revealing the exact date, magnitude, and depth. The code uses the vega-lite-api to construct the mark-circle encoding, with d3.csv for data loading. The dark-themed config customizes axis and label styling, while vega-tooltip provides interactive hover details.
AI-generated descriptionA visualization constructed using the vega-lite-api.
MIT Licensed



Comments
Sign in to join the discussion.