🌍 Public
2019 Ridgecrest Earthquakes
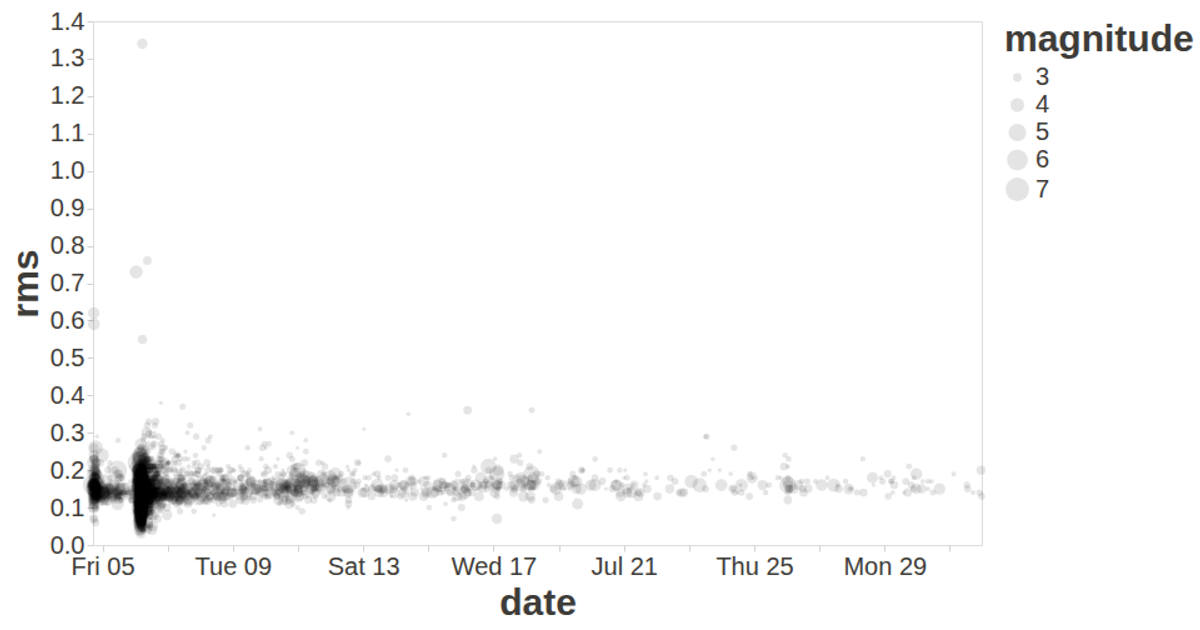
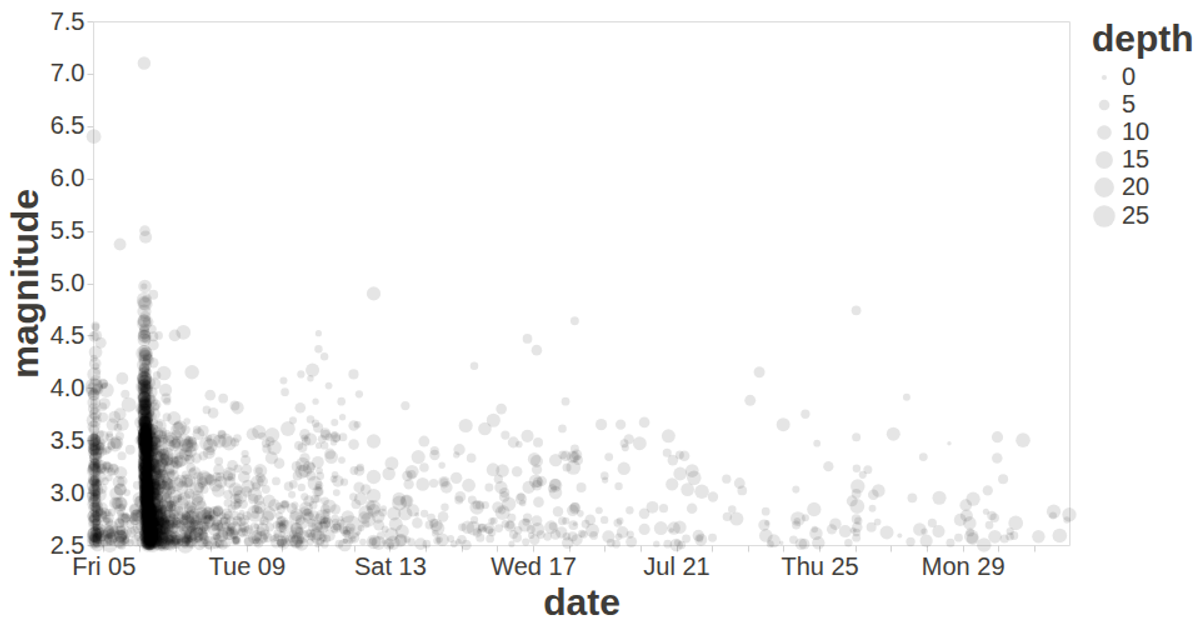
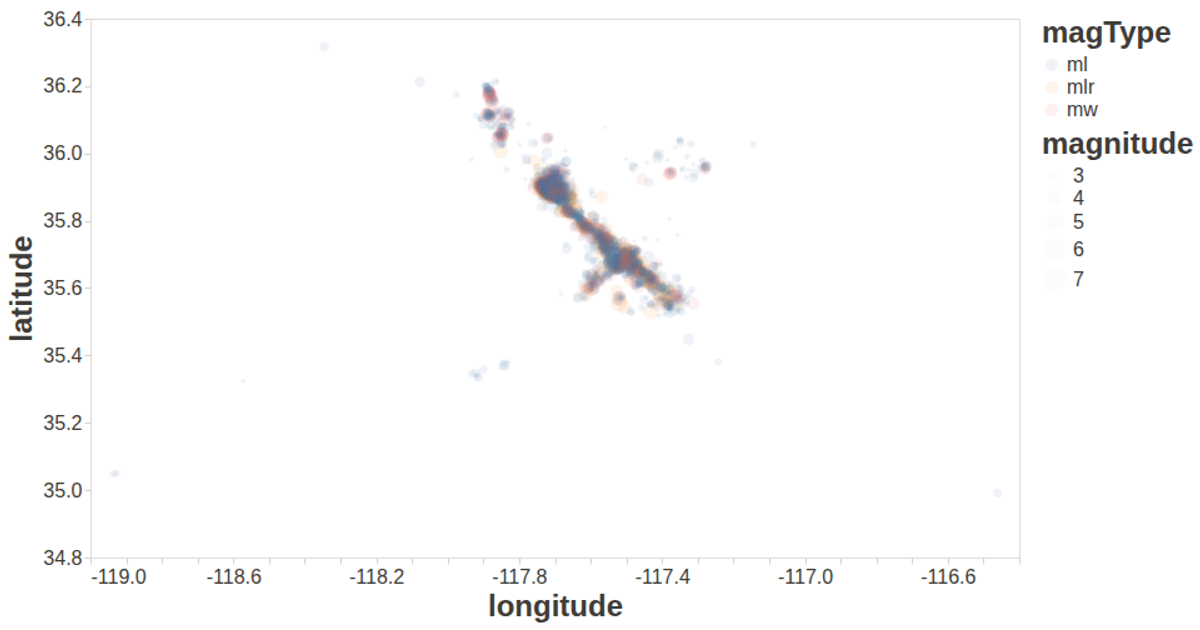
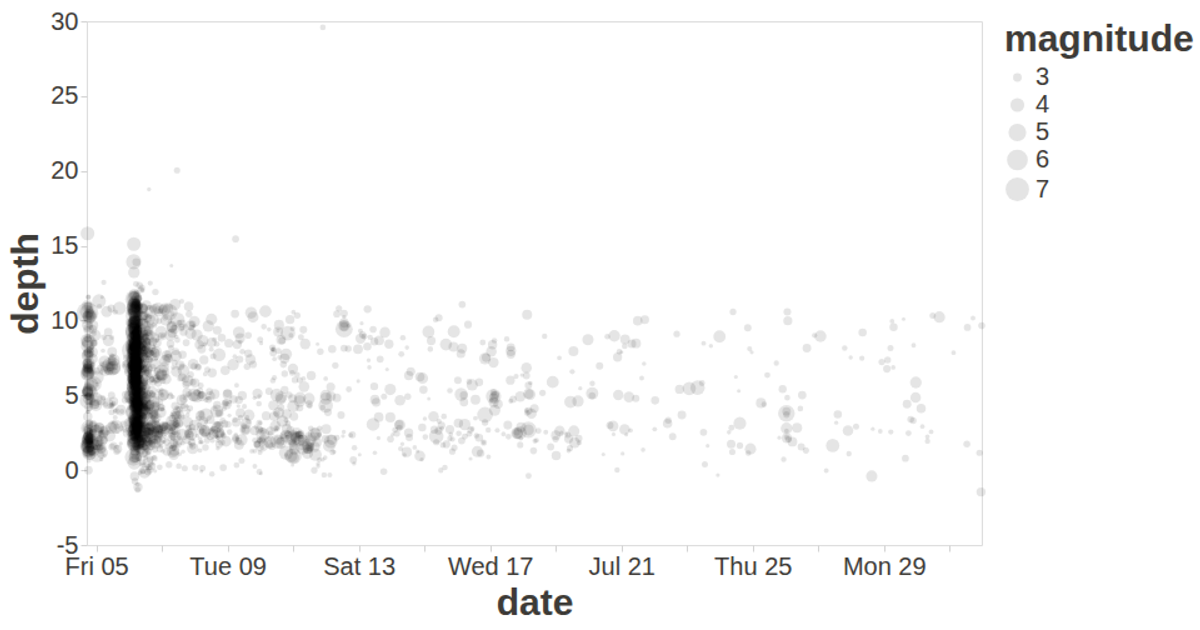
This visualization shows earthquakes from the 2019 Ridgecrest sequence as a scatterplot of time against root-mean-square error, with circle size encoding magnitude and color encoding magnitude type. It filters the data to events with low RMS and a date before the main shock, then renders the marks using the vega-lite-api, which builds a specification executed by Vega-Lite and rendered as SVG via Vega. The code loads data with d3.csv, applies custom axis and label styling through a config object, and includes a tooltip for displaying date, RMS, and depth on hover.
AI-generated descriptionA visualization constructed using the vega-lite-api.
MIT Licensed




Comments
Sign in to join the discussion.