🌍 Public
summary table
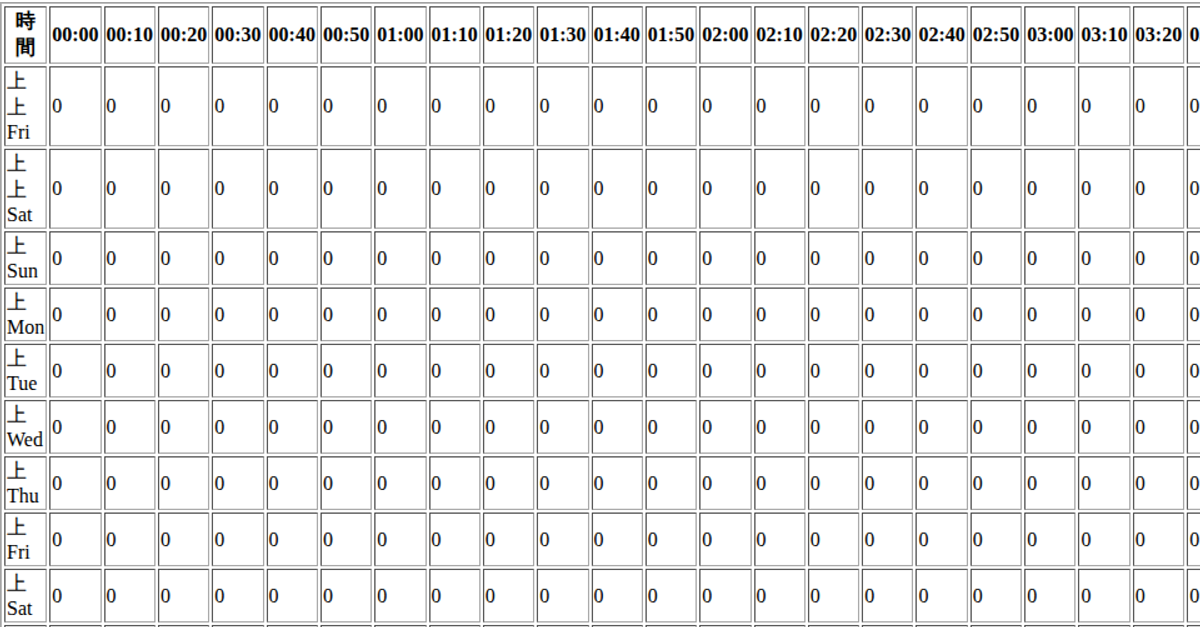
This example displays a summary table of daily power usage and capacity data, with each row representing a date and columns for each measured category, showing values as “used / cap.” The page fetches JSON data from a remote GitHub repository via the `fetch` API and builds the table dynamically using the Document Object Model (DOM) methods `insertRow`, `insertCell`, and `createElement`. The table’s header is generated from the first data entry’s keys, and all table content is rendered entirely through JavaScript on page load. It relies on the browser’s native `window.onload` event and JavaScript’s `response.json()` method.
AI-generated descriptionMIT Licensed






Comments
Sign in to join the discussion.