🌍 Public
Hourly Electricity Usage Trend
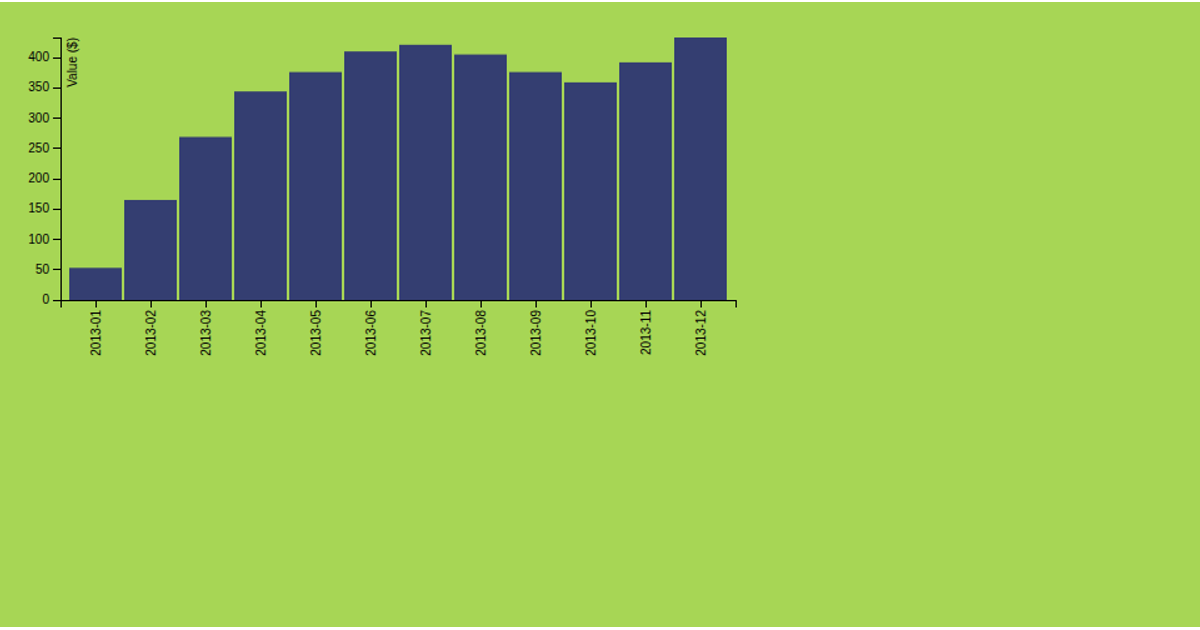
The visualization displays a 14-day hourly electricity usage trend as a grid table, comparing each day’s usage by hour (from 00:00 to 23:50) with color-coded numeric values. It fetches JSON data from a GitHub gist using the Fetch API, then processes timestamps with Moment.js to calculate differences between consecutive readings. The table is dynamically generated via JavaScript’s DOM manipulation, showing weekday labels like “上上” for older days. The data represents total electricity used across multiple categories, rounded to two decimal places.
AI-generated descriptionMIT Licensed





Comments
Sign in to join the discussion.