🌍 Public
台電即時資訊表
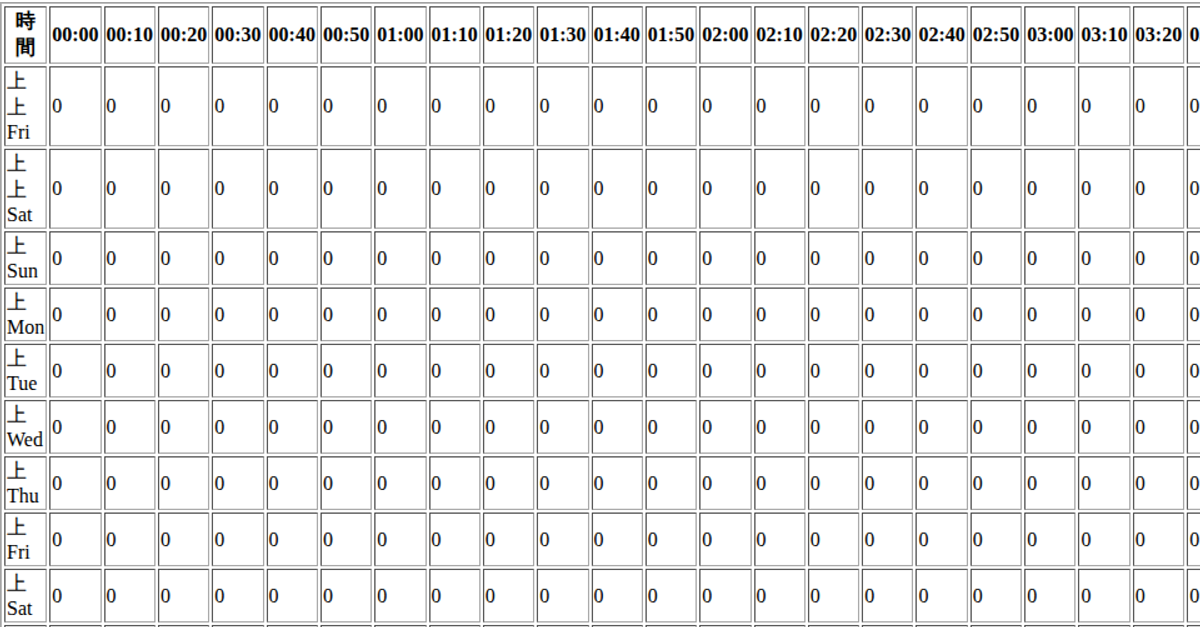
This live-updating table displays real-time power consumption and capacity data for Taiwan's power grid. It presents each timestamped record as a row, with columns for each consumption category, showing values as "used / cap" pairs. The visualization fetches JSON data from a remote GitHub repository using the `fetch` API, then dynamically constructs an HTML table by iterating through the data object. The code uses standard DOM manipulation methods like `insertRow()` and `insertCell()` to build the table structure without external visualization libraries.
AI-generated descriptionMIT Licensed






Comments
Sign in to join the discussion.