🌍 Public
Fork of Waste-Aggregation by gates
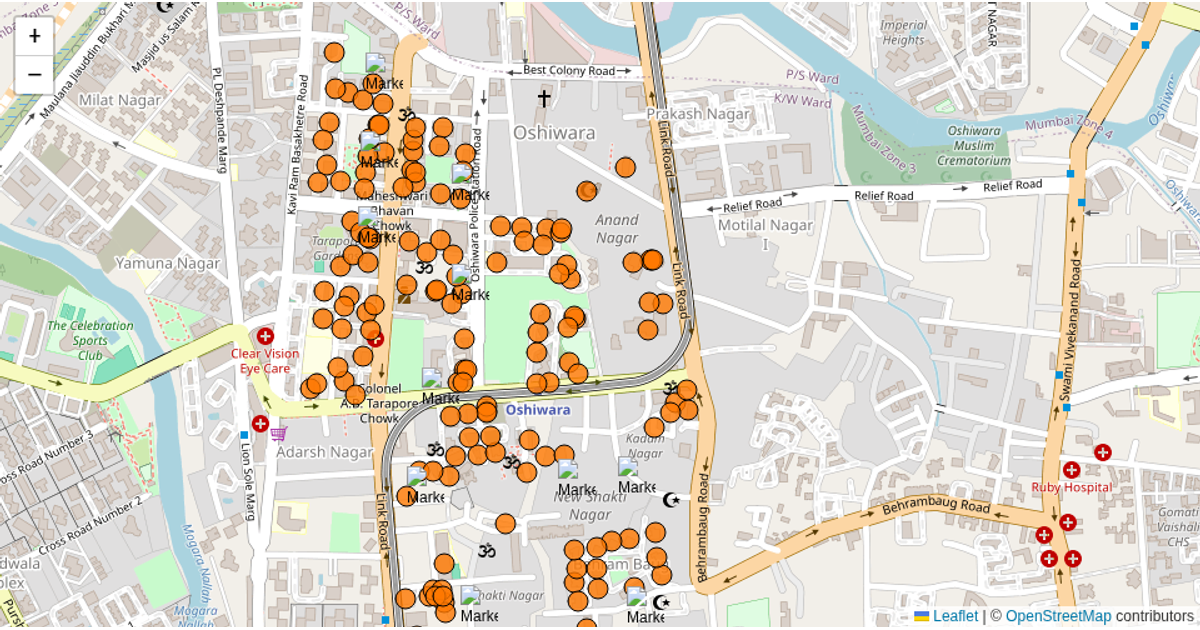
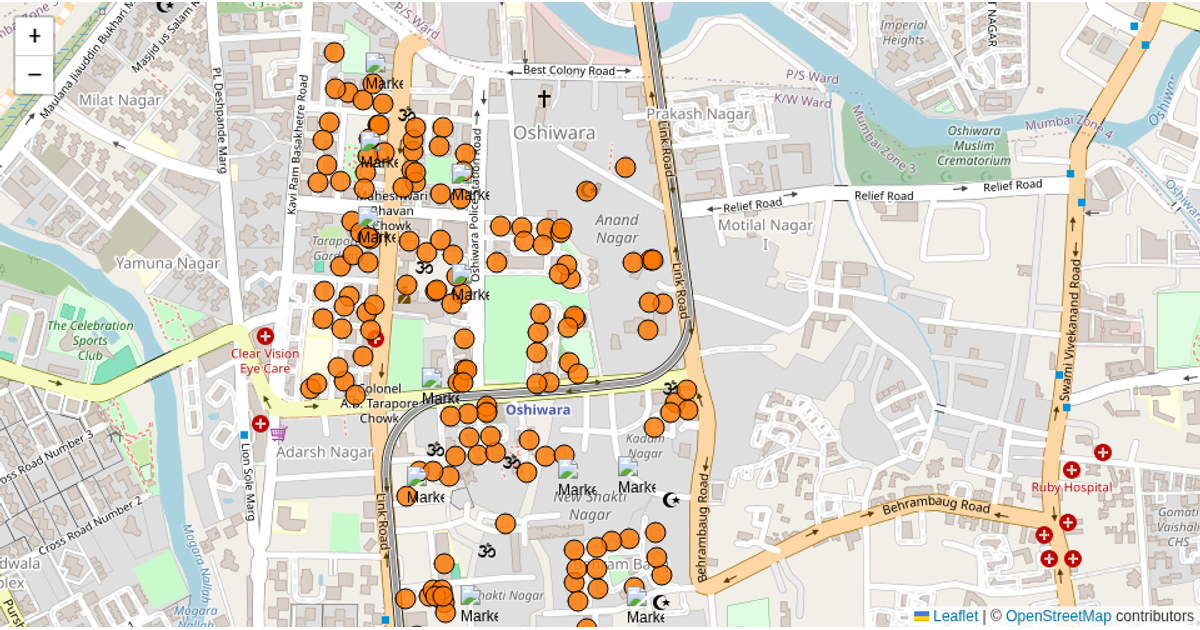
This interactive map visualizes waste aggregation and building population data across Ward 61, using colored circular markers to represent buildings and their associated waste metrics. The visualization displays building-level details such as dry/wet waste amounts and total population in popups upon clicking. Built with Leaflet for map rendering and D3.js (v5) for fetching GeoJSON data from a GeoNode server, the example layers building and gate locations over OpenStreetMap tiles. It also incorporates a mapping file that links buildings to waste collection gates, allowing for dynamic restyling of markers based on gate assignments.
AI-generated descriptionA bare minimum HTML page demonstrating use of CSS and JavaScript.
See also React Starter.
MIT Licensed




Comments
Sign in to join the discussion.