🌍 Public
Waste-Aggregation by gates
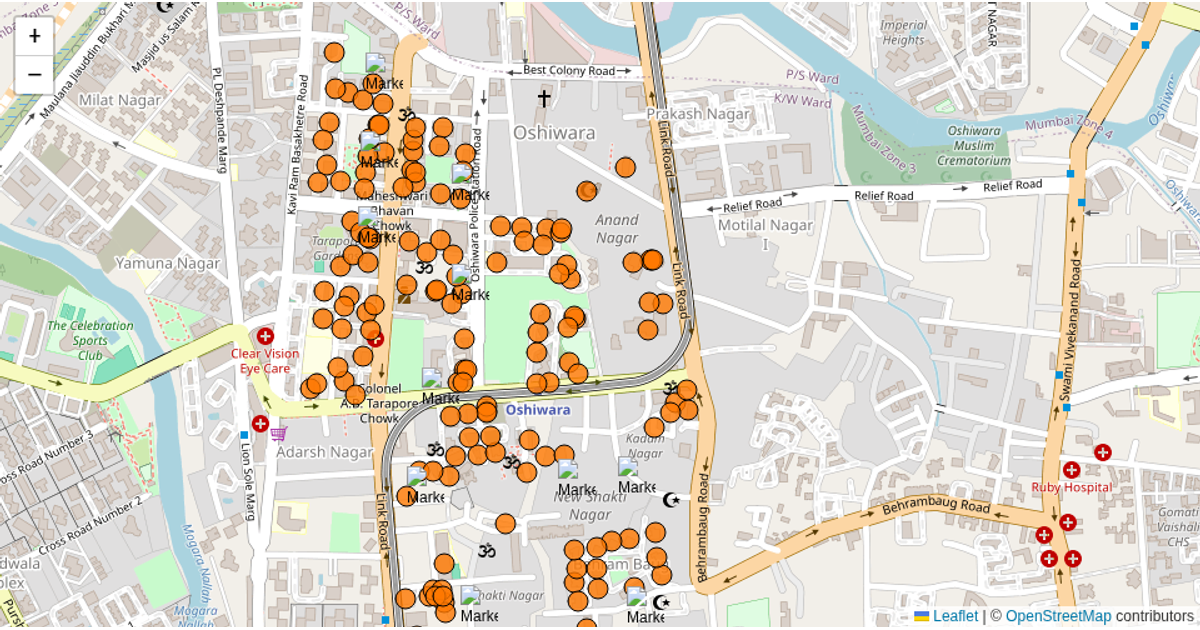
This interactive map visualizes waste aggregation across buildings and gates in a ward of Mumbai. It uses Leaflet with tile layers from OpenStreetMap, and fetches GeoJSON data for buildings, gates, and their mappings via D3’s `d3.json`. Building circles show population and waste metrics in popups, while clicking a gate re-renders the building layer with a custom styling function that highlights buildings linked to that gate in black, using data from a static gate-to-building JSON file. The map initializes at a zoom level of 16 centered on the ward.
AI-generated descriptionA bare minimum HTML page demonstrating use of CSS and JavaScript.
See also React Starter.
MIT Licensed




Comments
Sign in to join the discussion.