🌍 Public
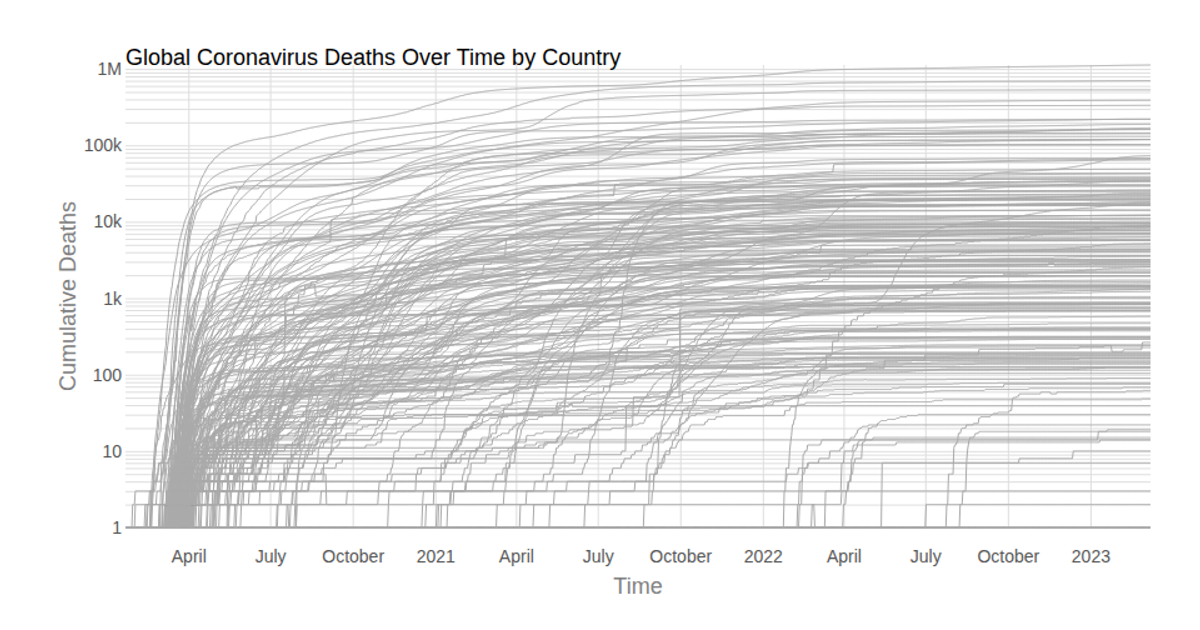
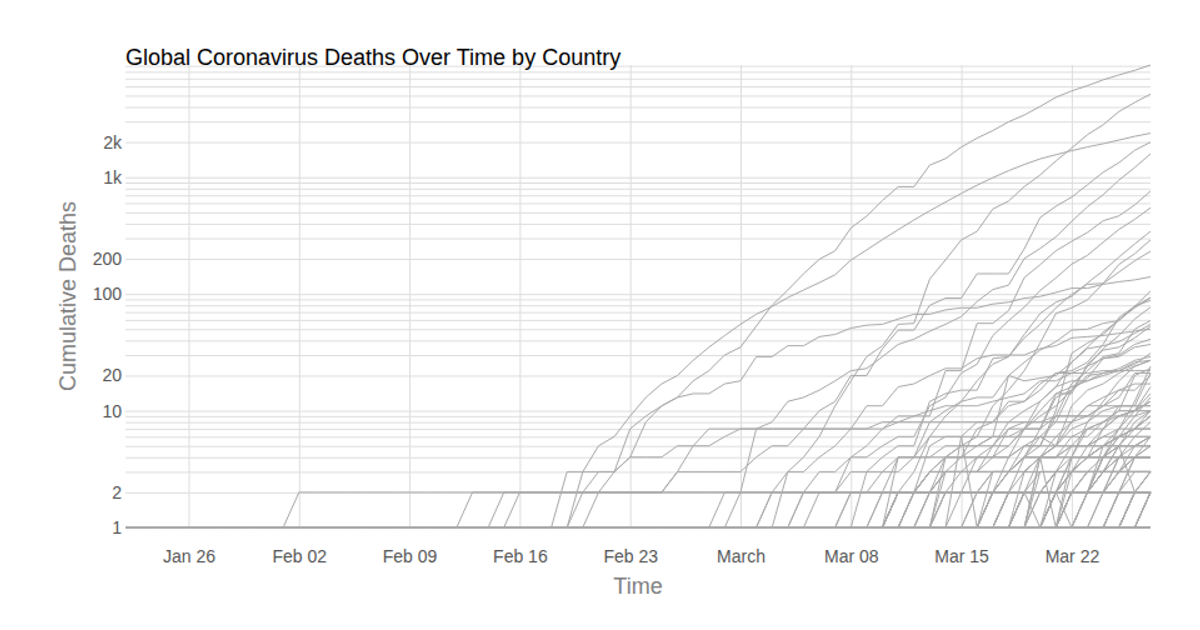
CANADA Coronavirus Deaths by Country over Time (with Voronoi Hover)
DDiavek
Last edited Apr 14, 2020
Created on Mar 29, 2020
A multi-line chart displays cumulative coronavirus deaths over time for Canada’s provinces, with each province represented by a gray line. A log-scaled y-axis and time-scaled x-axis frame the data. Hovering over any point activates a Voronoi overlay, built with d3.Delaunay, which highlights the nearest province’s line and shows a tooltip with the death count and date. Data comes from the Johns Hopkins Coronavirus dataset, rendered as SVG via React and D3 v5.
AI-generated descriptionLine chart of Coronavirus cases to date, by country. Data from Johns Hopkins Coronavirus Dataset.
Hover to see details and illuminate lines.
MIT Licensed




Comments
Sign in to join the discussion.