🌍 Public
Curran's Coronavirus Deaths by Country over Time (with Voronoi Hover)
AAndrea Picciau
Last edited Nov 7, 2021
Created on Nov 6, 2021
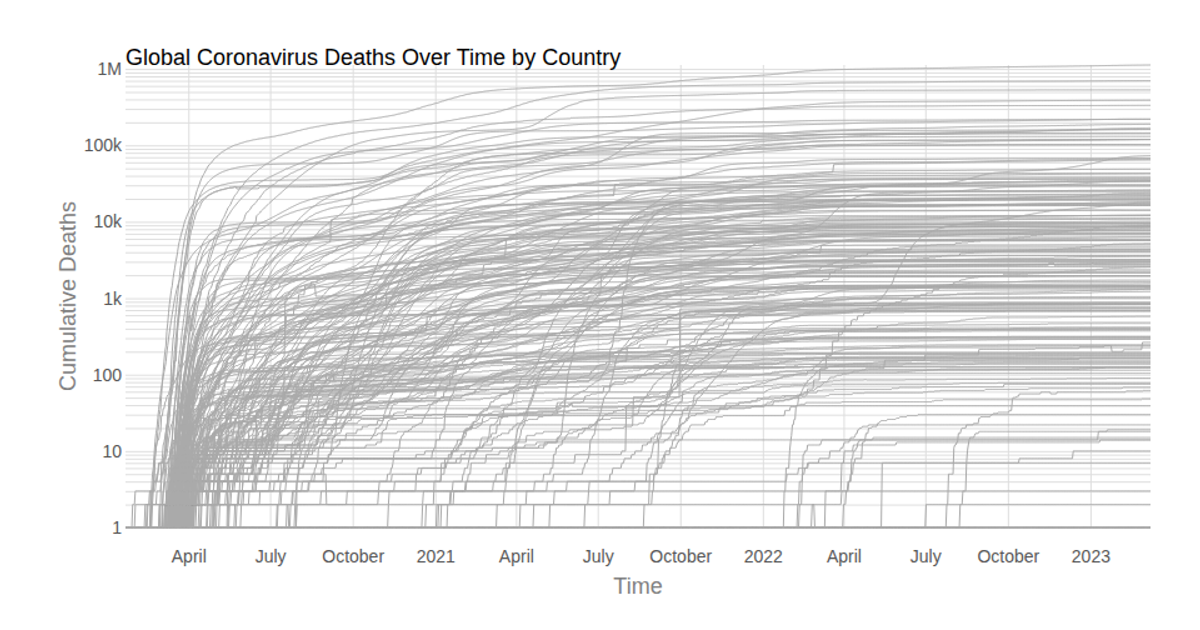
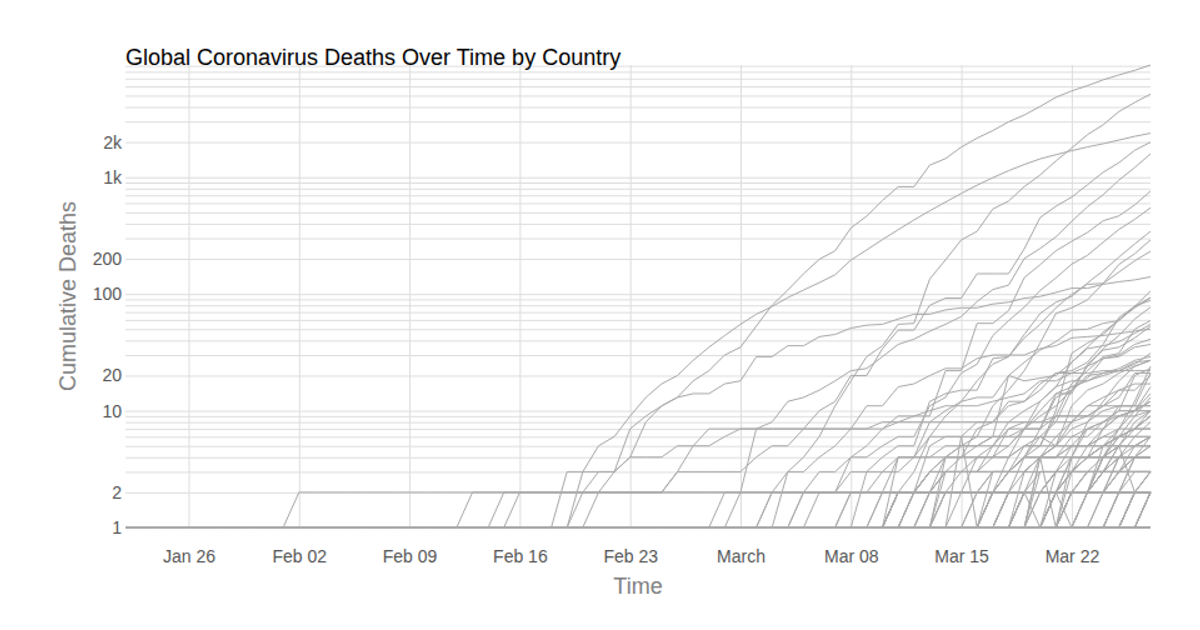
This multi-line chart shows cumulative COVID-19 deaths over time for each country, with all countries plotted using semi-transparent gray lines. A Voronoi overlay enables hover interaction, highlighting the nearest data point’s country and displaying a tooltip with its name, death total, and date. Built with React and D3 v5, the visualization uses `d3.scaleLog` for the y-axis, `d3.scaleTime` for the x-axis, and `d3.Delaunay` from the `d3-delaunay` library to construct the Voronoi cells for efficient hit-testing. Data comes from the Johns Hopkins Coronavirus dataset.
AI-generated descriptionLine chart of Coronavirus cases to date, by country. Data from Johns Hopkins Coronavirus Dataset.
Hover to see details and illuminate lines.
MIT Licensed



Comments
Sign in to join the discussion.