🌍 Public
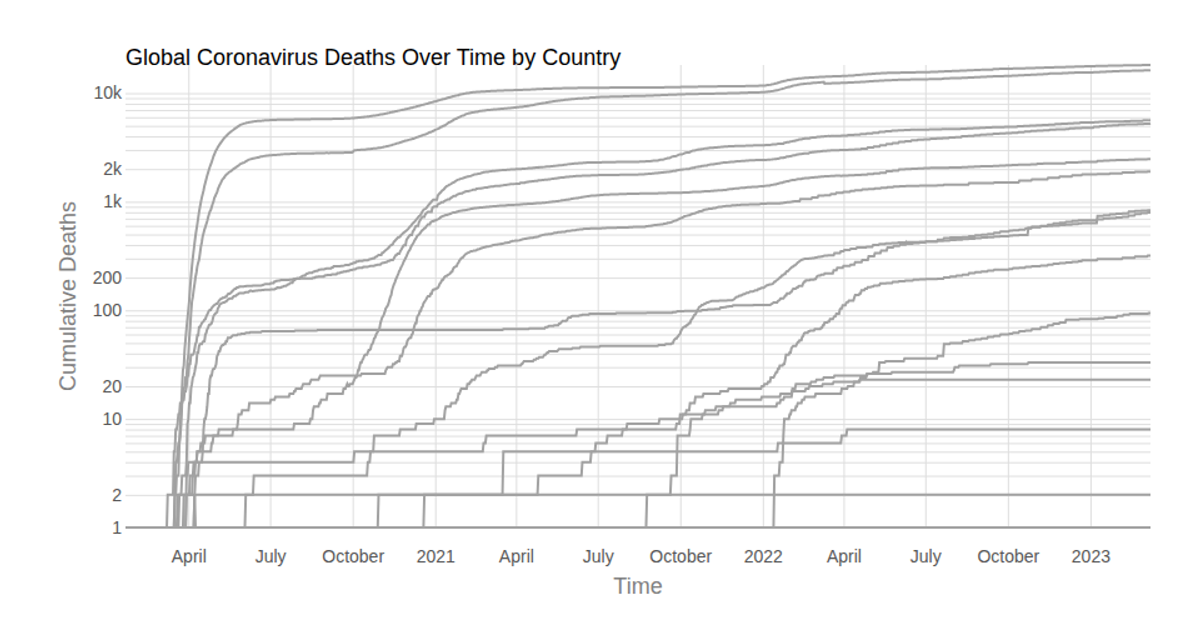
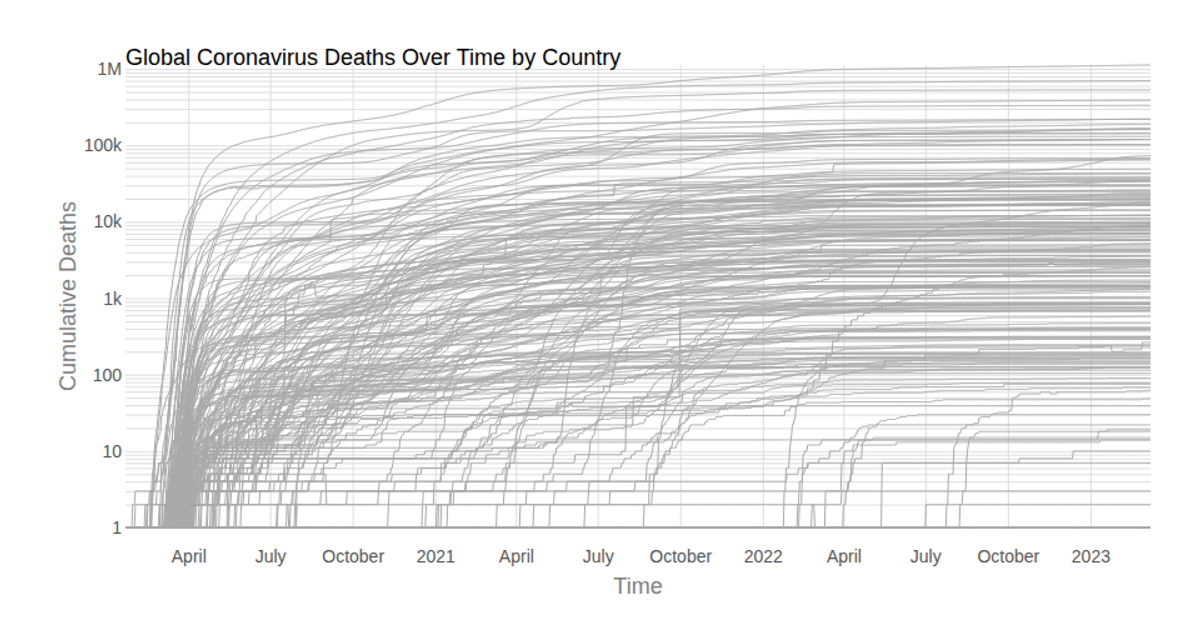
Fork of CANADA Coronavirus Deaths by Country over Time (with Voronoi Hover)
Mmathieu34
Last edited Jun 2, 2021
Created on Jun 2, 2021
This visualization displays cumulative COVID-19 deaths across Canadian provinces over time, using a logarithmic scale to accommodate the wide range of values. A Voronoi overlay, built with the d3-delaunay library, enables hover interactions that highlight the selected province’s line and display a tooltip with the exact date and death count. The chart is rendered as an SVG using React and D3 v5, pulling data from the Johns Hopkins Coronavirus dataset.
AI-generated descriptionLine chart of Coronavirus cases to date, by country. Data from Johns Hopkins Coronavirus Dataset.
Hover to see details and illuminate lines.
MIT Licensed



Comments
Sign in to join the discussion.