🌍 Public
Fork of Trial of Interactive Color Legend
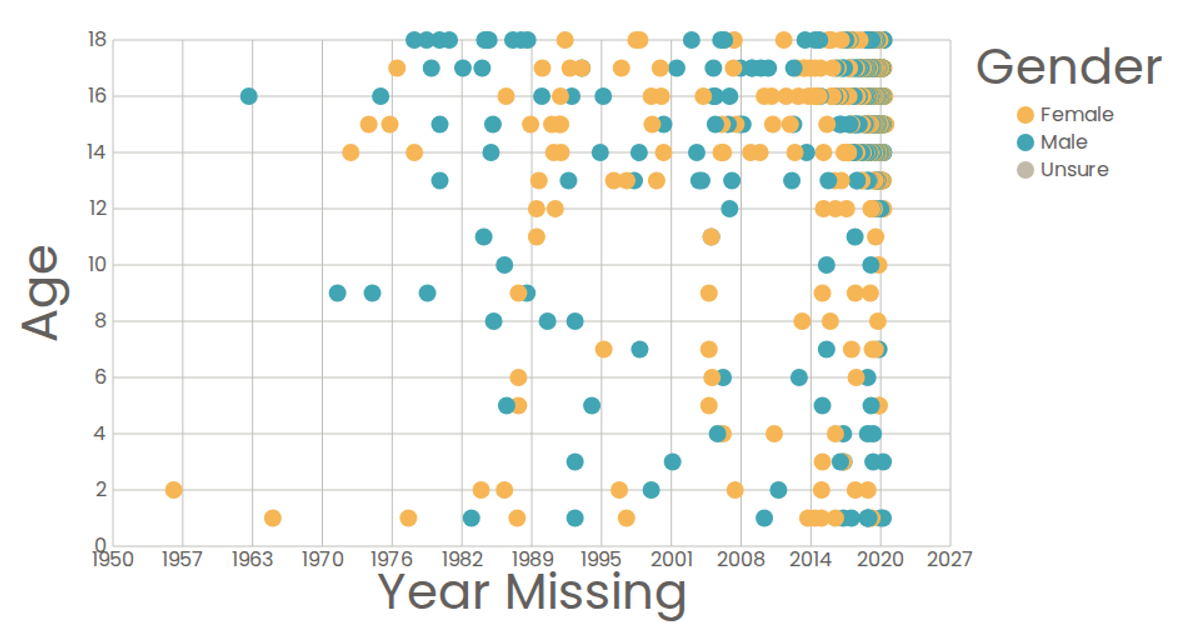
This interactive scatter plot visualizes California missing persons data, allowing users to explore relationships between attributes like age, county, and gender. A color legend for gender is interactive, highlighting points of a selected category while fading others via React state management and hover events. The visualization uses React components, D3 scales for positioning, and renders as SVG. The data is loaded using D3’s `csv` parser from a GitHub gist, with dropdown menus controlling the X and Y axis attributes.
AI-generated descriptionA scatter plot of The Iris Dataset.
MIT Licensed




Comments
Sign in to join the discussion.