🌍 Public
Fork of Interactive Color Legend
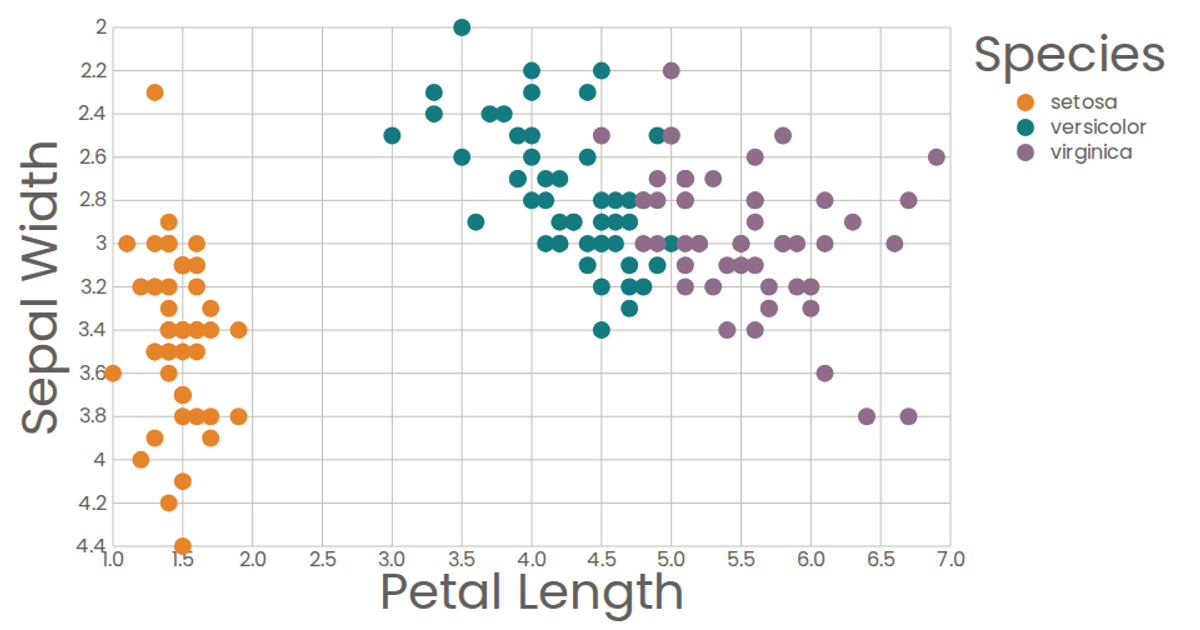
This example shows an interactive scatter plot of the Iris Dataset, where hovering over a species name in the color legend fades all non-matching data points and highlights the selected group. The visualization uses React components to render SVG circles scaled with d3.scaleLinear and colored by d3.scaleOrdinal, while the legend interacts through mouse events managed by React state.
AI-generated descriptionA scatter plot of The Iris Dataset.
MIT Licensed


Comments
Sign in to join the discussion.