🌍 Public
Fork of Interactive Color Legend
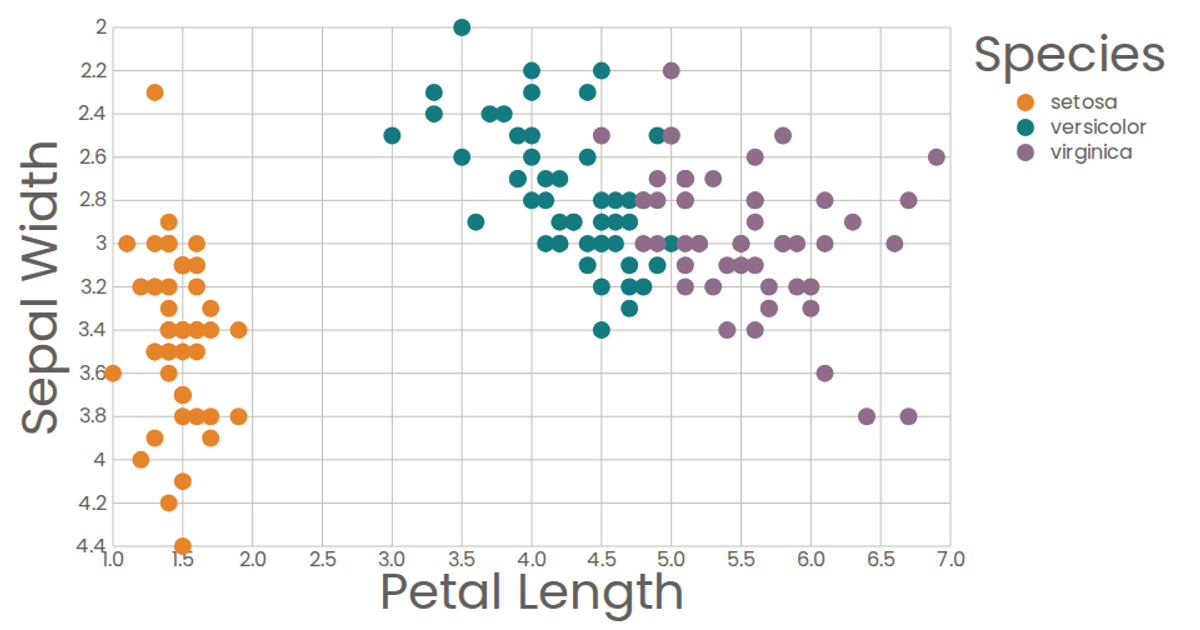
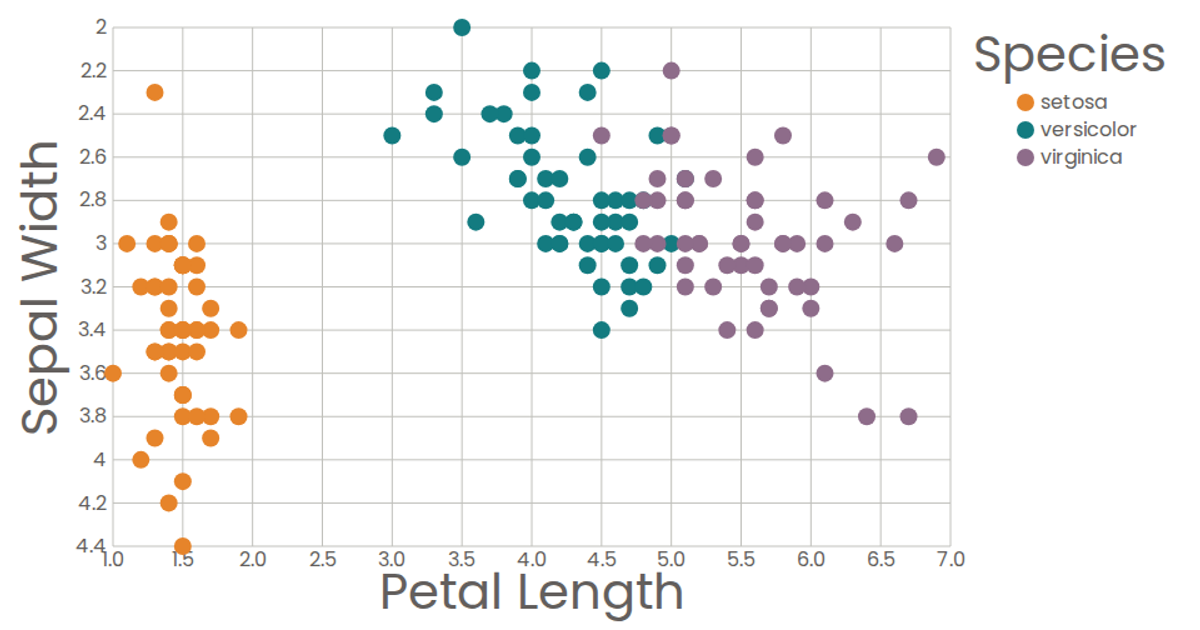
This interactive scatter plot visualizes the Iris dataset, plotting days since the first attack against distance from it, with points colored by region. Hovering over a region in the color legend highlights matching data points and fades the rest, providing a clear way to explore categorical groupings. Built with React and D3 v5, the visualization uses `scaleLinear` for axes, `scaleOrdinal` for colors, and a custom `ColorLegend` component that tracks hover state.
AI-generated descriptionA scatter plot of The Iris Dataset.
MIT Licensed




Comments
Sign in to join the discussion.