🌍 Public
Fork of HTML Starter
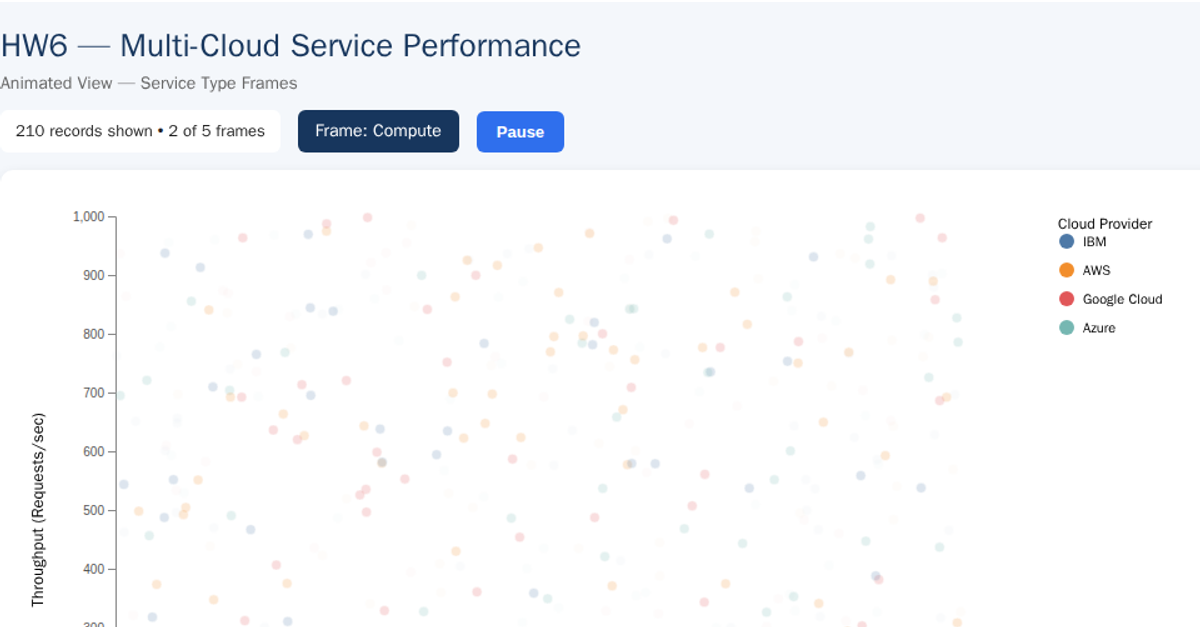
This scatter plot compares CPU utilization against throughput for cloud services, with each point colored by cloud provider and labeled by service ID. Built with d3.csv and d3.select, it renders an SVG chart featuring axes, a legend, and tooltips that appear on hover. The visualization uses d3.append for graphical elements and d3.attr for styling, loading structured data from a CSV file to display performance metrics across multiple cloud service types.
AI-generated descriptionMIT Licensed




Comments
Sign in to join the discussion.