🌍 Public
AI Tool Usage
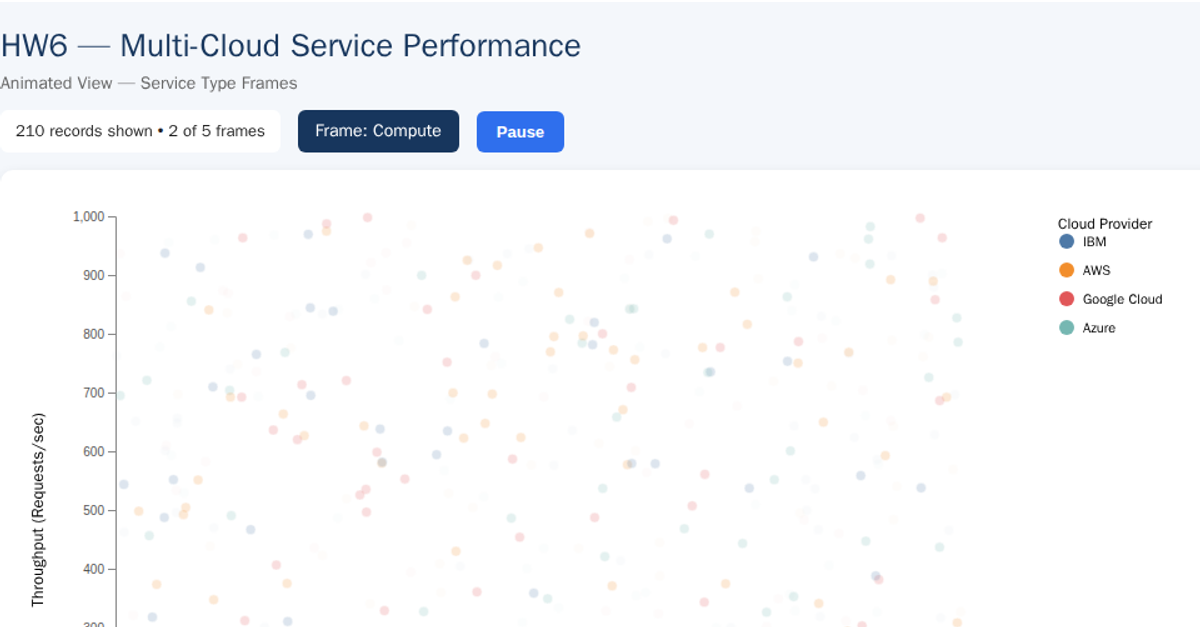
This visualization uses small multiples to compare cloud provider performance across service types. Each panel displays a scatter plot of CPU utilization percentage against throughput requests per second, with points colored by cloud provider using a Tableau10 scheme. The d3.v7 code loads CSV data, shares x and y linear scales across all panels for consistent comparison, and uses `d3.scaleOrdinal`, `d3.extent`, and `d3.csv`. The SVG rendering includes panels arranged in a three-column grid with axes, titles, and a legend.
AI-generated descriptionMIT Licensed




Comments
Sign in to join the discussion.