🌍 Public
CSCE 5320 HW6 - Q1 3D Cloud Performance
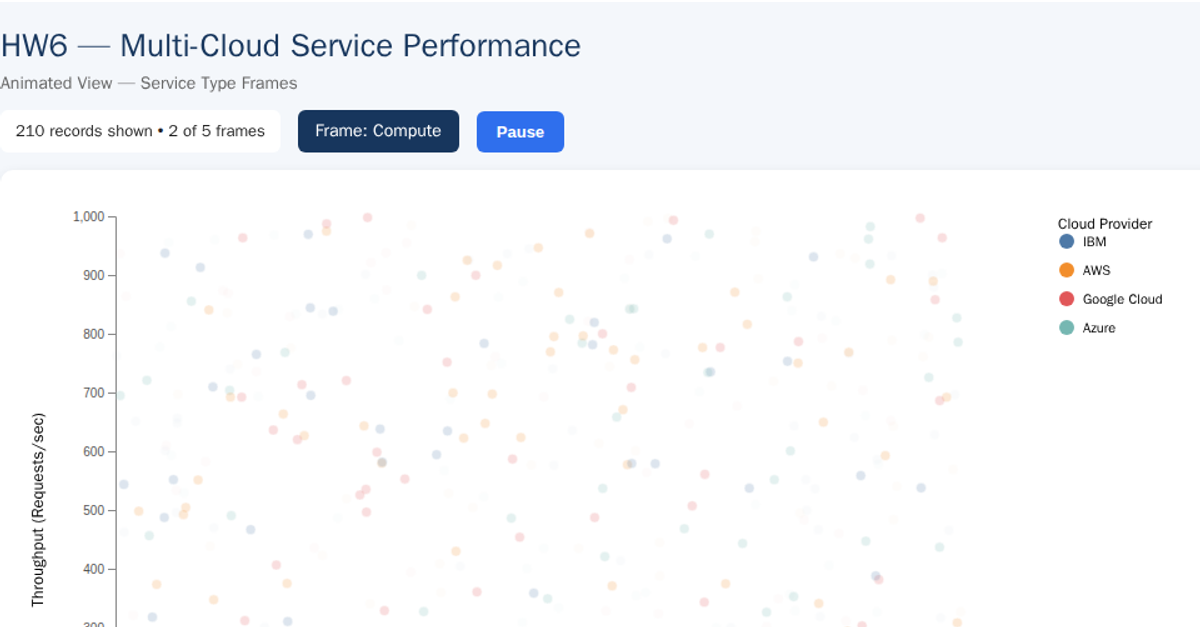
This 3D scatter plot visualizes cloud-service performance across four providers (AWS, Azure, Google Cloud, IBM), showing CPU utilization, throughput, and service latency as x, y, and z coordinates. Each provider is color-coded with hover tooltips revealing service IDs, types, and exact metric values. Built with Plotly’s `scatter3d` trace type and D3 v7 for CSV loading and data parsing, the visualization reads from a GitHub-hosted CSV file and renders in an interactive, rotatable 3D scene with a fixed camera angle.
AI-generated descriptionMIT Licensed




Comments
Sign in to join the discussion.