🌍 Public
Choropleth Map
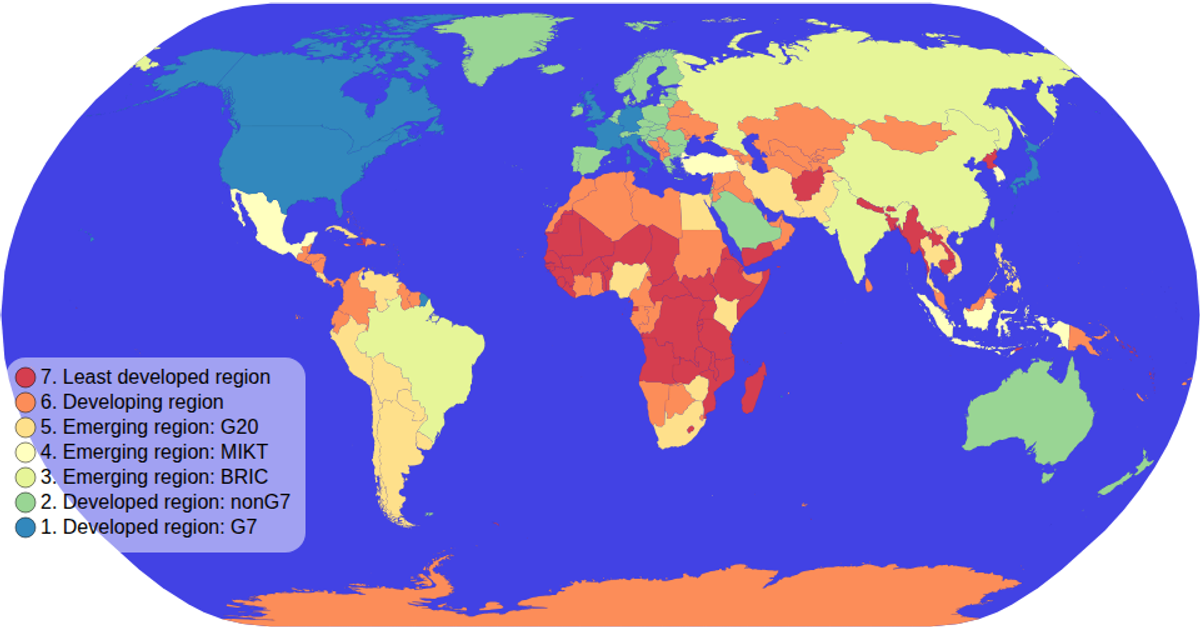
This choropleth map colors countries by economic classification using a sequential yellow-orange color scale from the World Atlas TopoJSON dataset. The view uses a natural Earth projection, renders as SVG, and includes pan and zoom via d3.zoom. A custom color legend displays the ordinal scale, while hovering highlights each country with a tooltip showing its name and economy value. The implementation combines d3.geoPath, topojson.feature, and a reusable colorLegend module.
AI-generated descriptionMIT Licensed




Comments
Sign in to join the discussion.