🌍 Public
Choropleth Map Argentina Dptos Corona
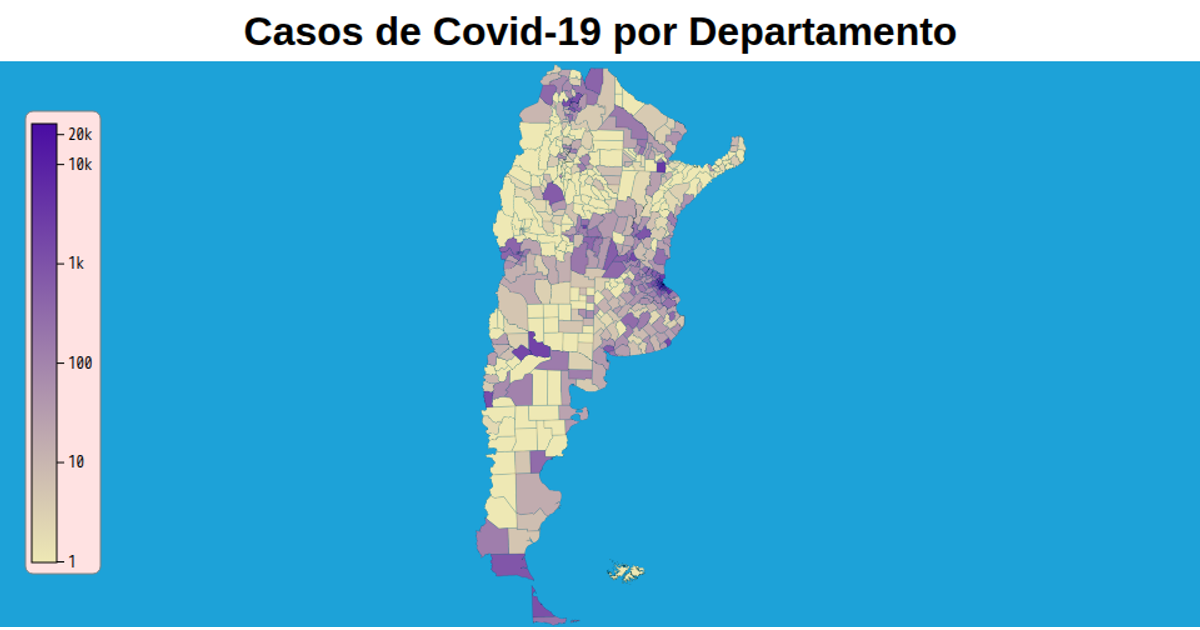
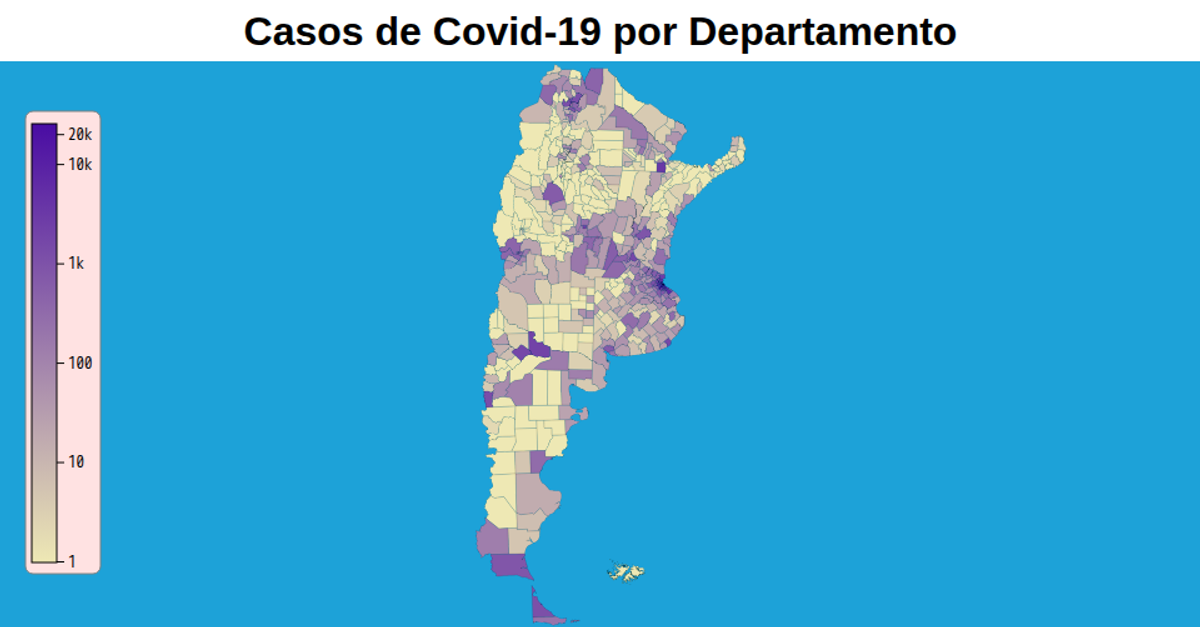
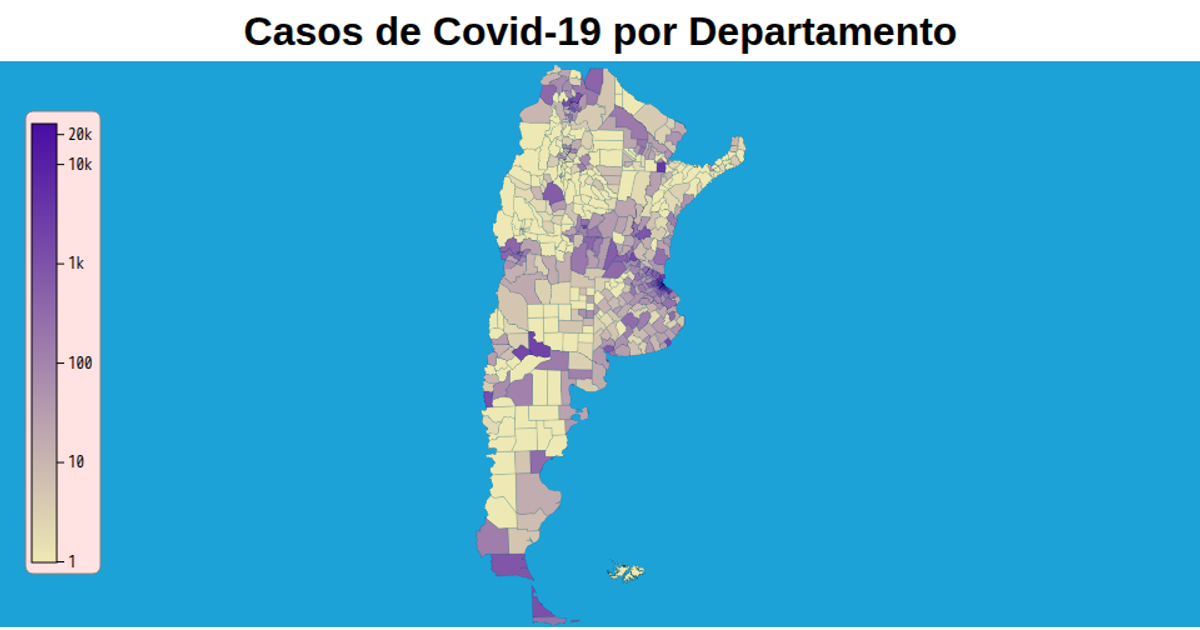
A choropleth map of Argentine departments displays COVID-19 case counts using a logarithmic color scale transitioning from blue to red. The visualization includes a color legend with a corresponding logarithmic axis. The map is rendered as an SVG using d3.geoPath, while the color scale and legend are constructed with d3.scaleLog and d3.axisBottom, with data projected via d3.geoTransverseMercator.
AI-generated descriptionMIT Licensed




Comments
Sign in to join the discussion.