🌍 Public
Fork of Visual Editor Demo
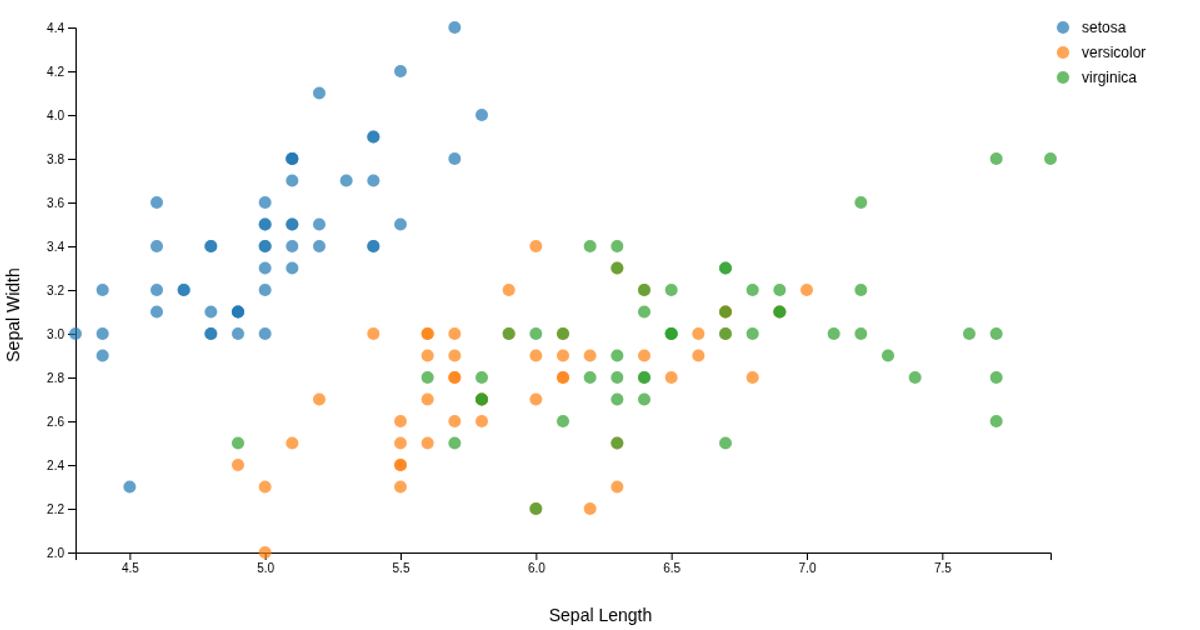
This interactive scatter plot visualizes the classic Iris dataset, plotting sepal length against sepal width with each species color-coded. The visualization uses the d3-rosetta library for unidirectional data flow, allowing D3 v7 and React to work together while maintaining a single state. Users can adjust the point radius and left margin through a visual editor that updates the configuration via postMessage events. A loading state is shown while the CSV data loads asynchronously from config.json.
AI-generated descriptionMIT Licensed




Comments
Sign in to join the discussion.