🌍 Public
Visual Editor PoC
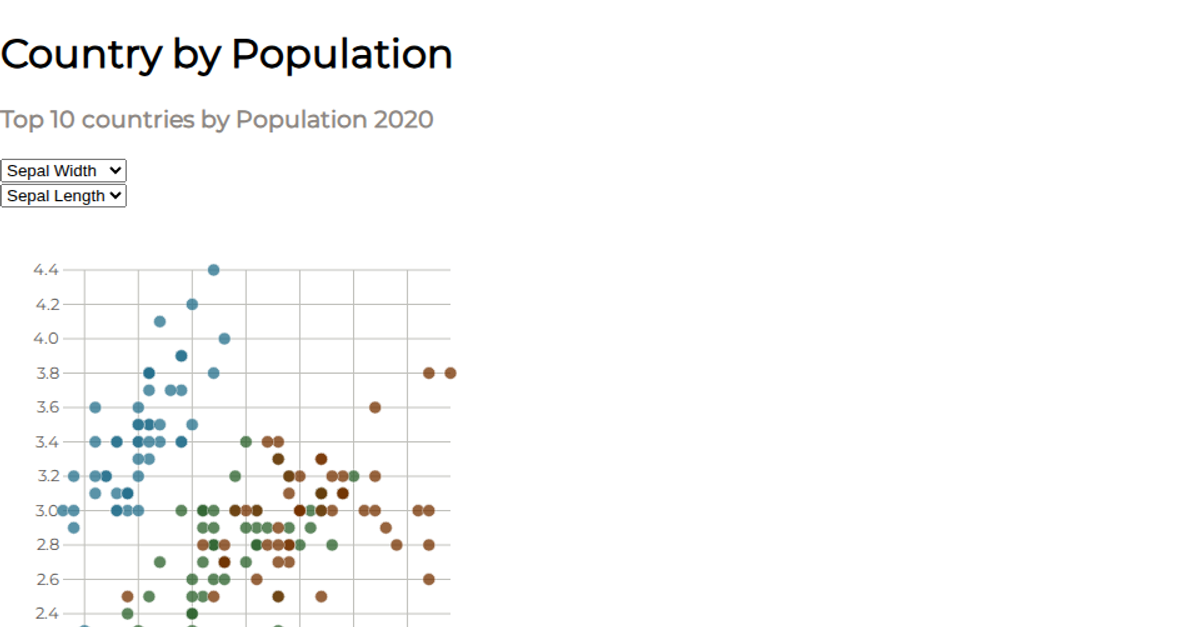
This example demonstrates a proof-of-concept visual editor for interactive scatter plot configuration, displaying the Iris dataset with adjustable point radius via a slider widget. The visualization uses D3 v7 scales and axes for rendering, with d3-rosetta managing unidirectional data flow between state and DOM updates. Config parameters like margins, colors, and labels are loaded from JSON and can be modified through postMessage events.
AI-generated descriptionThis is a PoC for some ideas around creating a "Visual Editor", with widgets like sliders and color pickers for tweaking config parameters.
See also:
MIT Licensed




Comments
Sign in to join the discussion.