🌍 Public
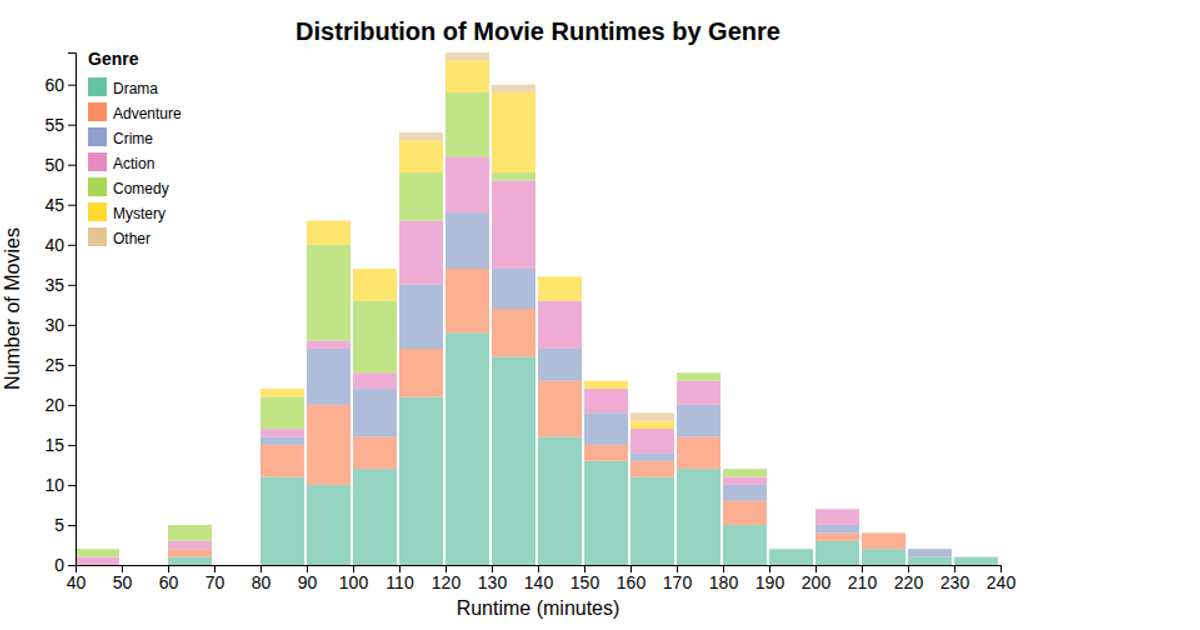
Week 9: IMDB Top 250 Movies Histogram: Distribution of Movie Runtimes by Genre
XXiaojun
Last edited Oct 27, 2025
Created on Oct 21, 2025
This stacked histogram visualizes the distribution of movie runtimes across the top six most frequent genres from the IMDB Top 250 dataset, using 10-minute bins. It shows how each genre's movie count contributes to the total for each runtime interval. The visualization uses D3's `scaleLinear`, `bin`, and `scaleOrdinal` APIs to create the bars, with categories sorted by frequency and an "Other" grouping for remaining genres. The legend identifies color assignments for each genre.
AI-generated descriptionMIT Licensed



Comments
Sign in to join the discussion.