🌍 Public
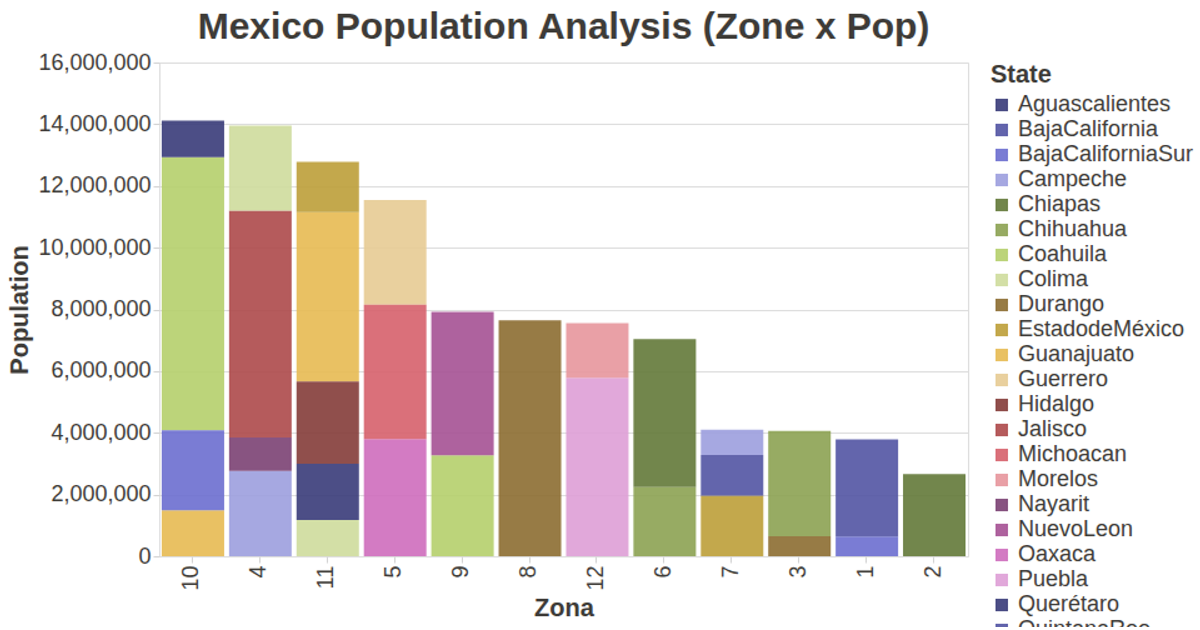
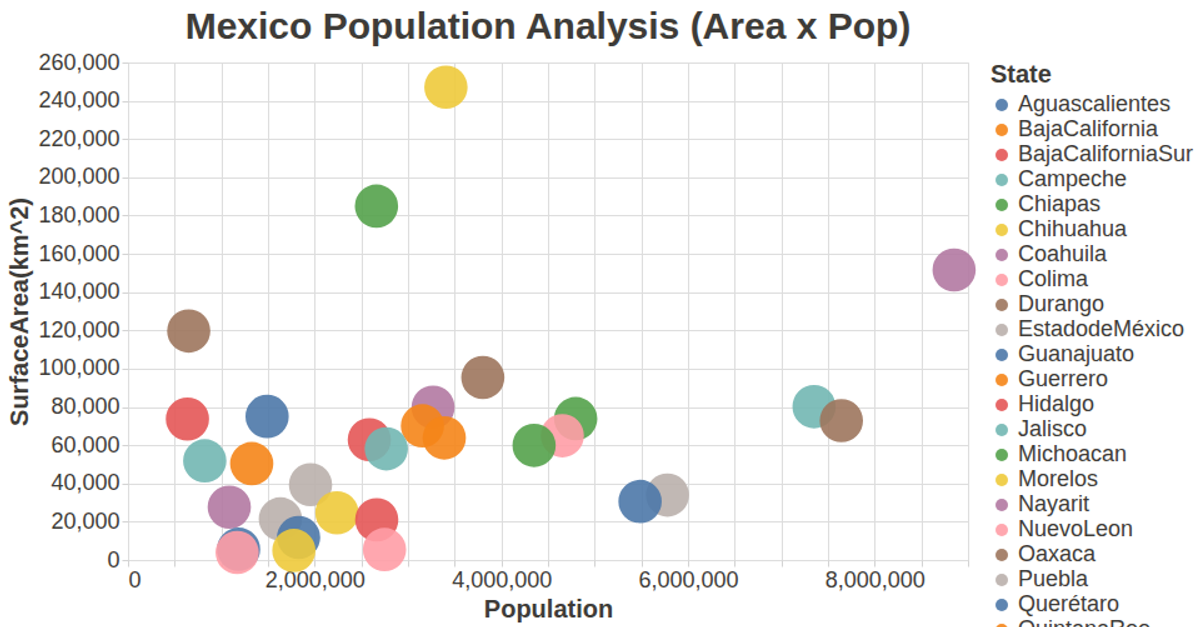
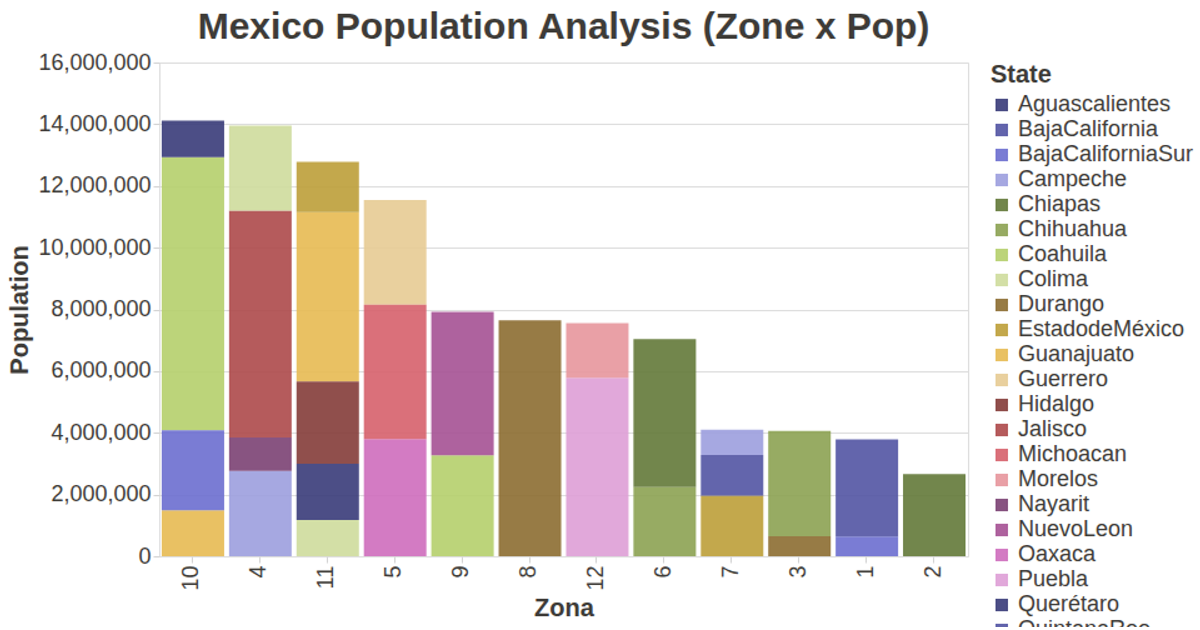
Mexico Population Analysis (Zone Prop)
This visualization plots Mexican population data against geographic zones, with each point representing a zone and its population on the x-axis and zone identifier on the y-axis. The color and tooltip encode surface area in square kilometers. The chart uses the vega-lite-api to construct a circle mark specification, which is rendered by Vega-Lite and Vega with an SVG output. Data is loaded asynchronously via d3.csv from a GitHub-hosted CSV file, and the visualization is configured with custom axis and title styling in config.js.
AI-generated descriptionA visualization constructed using the vega-lite-api.
MIT Licensed



Comments
Sign in to join the discussion.