🌍 Public
Vega-Lite MFRED Hourly Kw vs Time
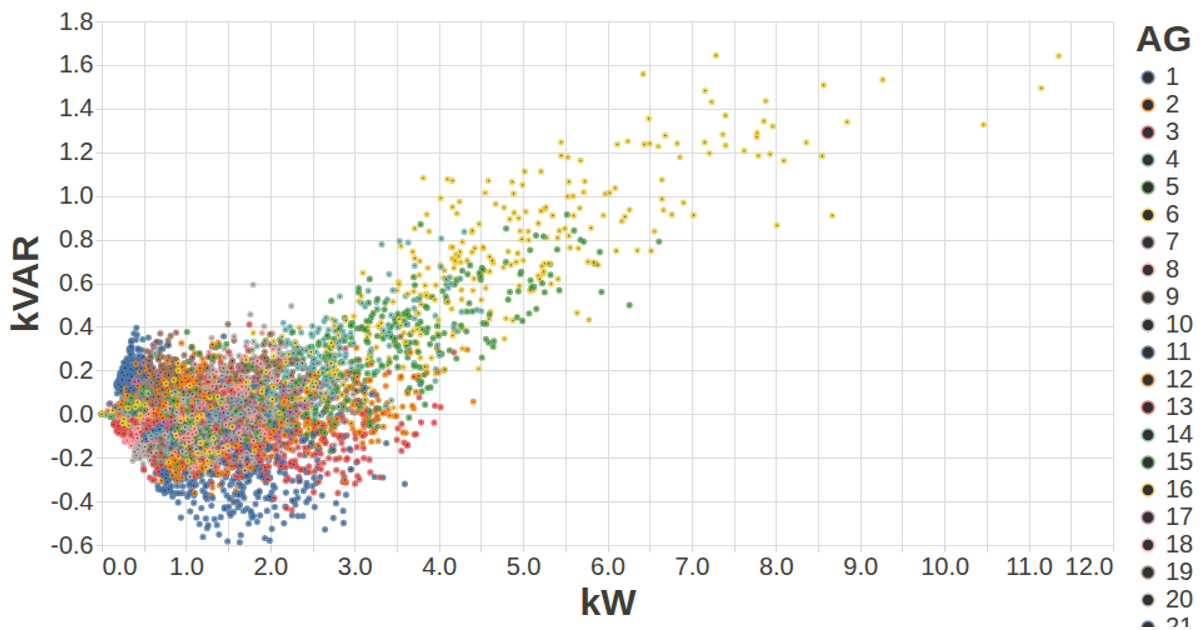
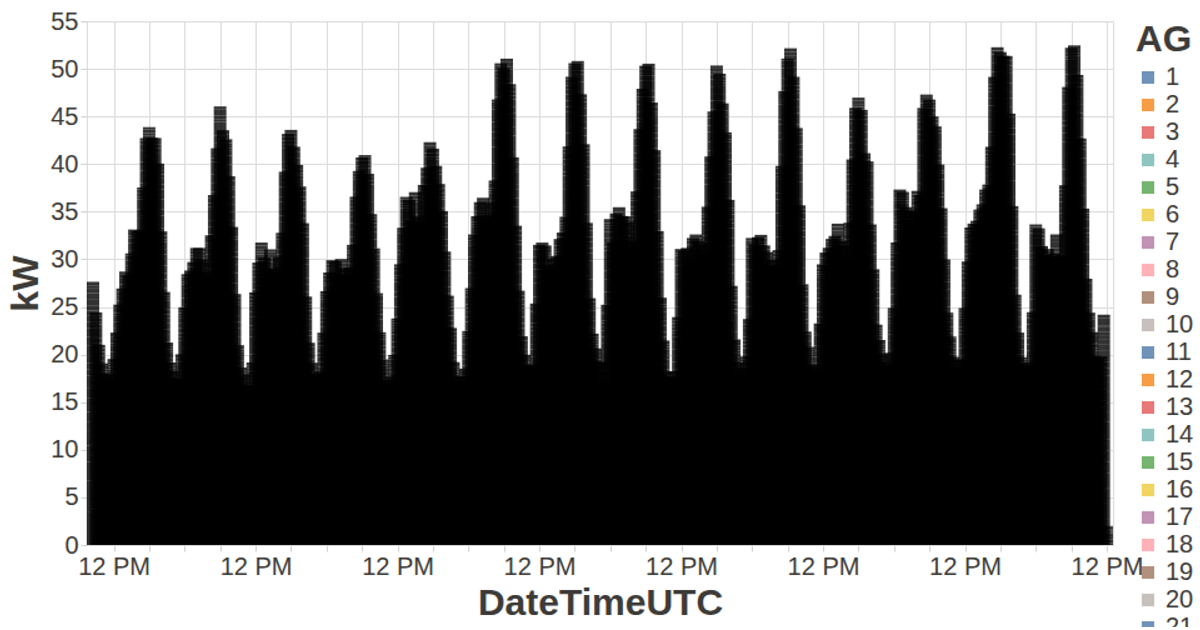
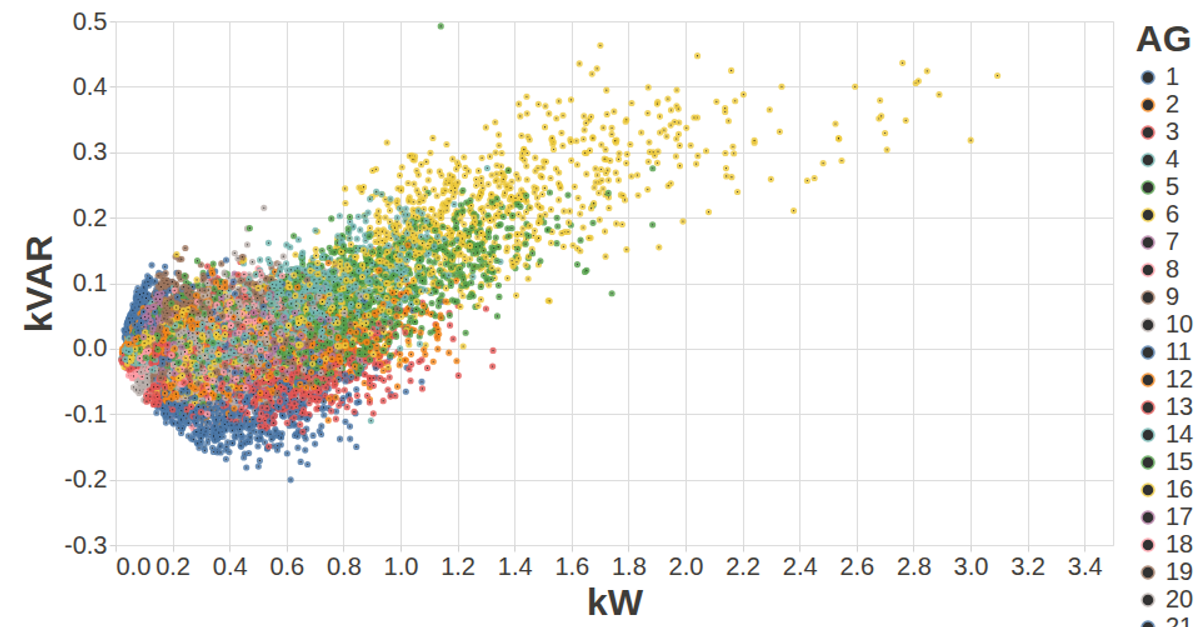
This visualization plots hourly kilowatt readings from the MFRED dataset against time, with each of the 26 generator units (AG01 through AG26) colored distinctly by category. It uses the Vega-Lite API, registered with vega and vega-lite, to render point marks on an SVG canvas. The data is loaded via d3.csv, aggregated from 15-minute intervals into hourly totals using d3.group, and the chart auto-fits to the window size. Tooltips display the generator name on hover.
AI-generated descriptionA visualization constructed using the vega-lite-api.
MIT Licensed



Comments
Sign in to join the discussion.