🌍 Public
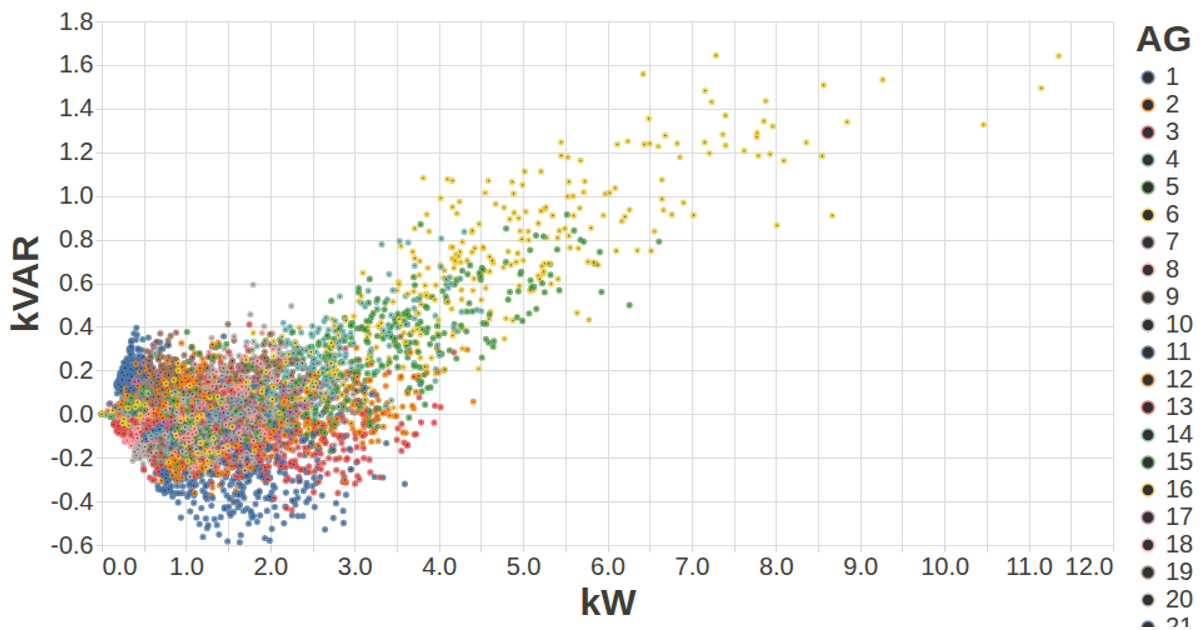
Vega-Lite MFRED Visualization KVAR vs KWh
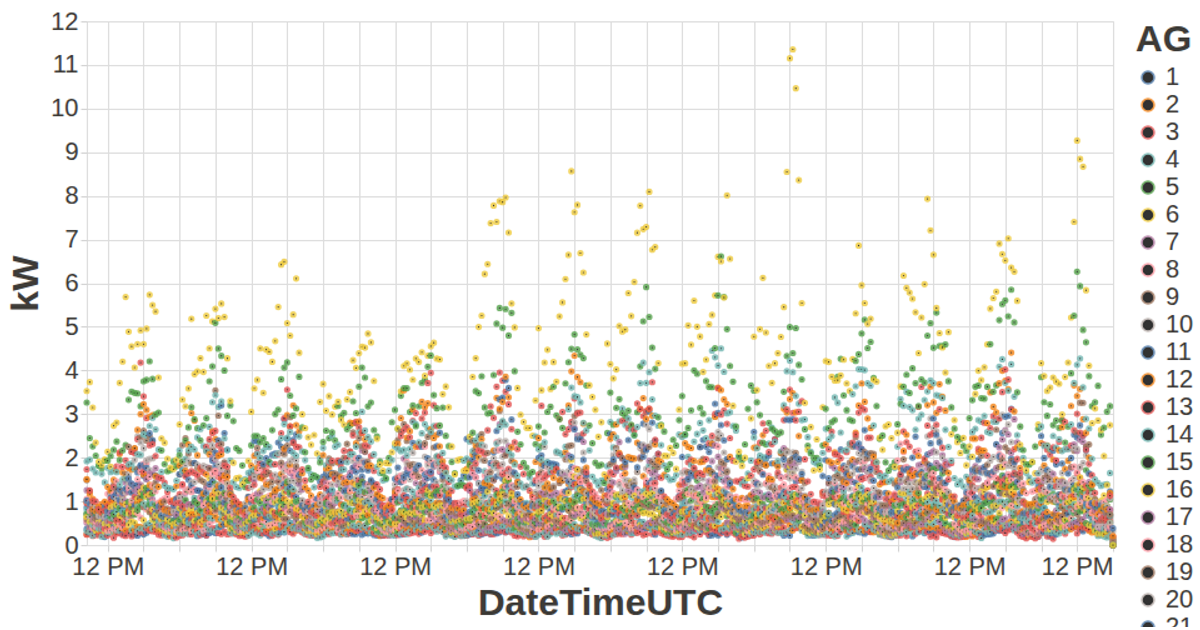
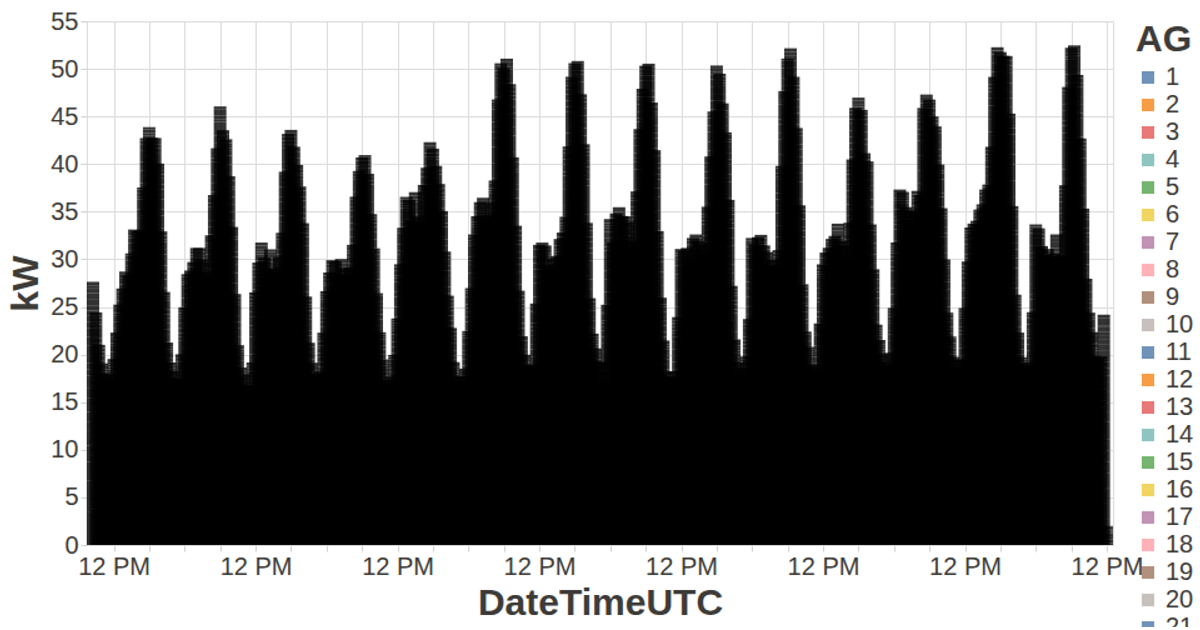
This visualization plots kW against kVAR for each of 26 aggregate generators in the MFRED dataset, with points colored by generator ID to compare real versus reactive power output. It uses the Vega-Lite API with d3.v5 for data loading, transposing the CSV into per-generator records via `getData`. The chart applies custom axis and label styling from `config.js`, renders as an SVG through vega-tooltip, and displays 15-minute interval data across all generators.
AI-generated descriptionA visualization constructed using the vega-lite-api.
MIT Licensed



Comments
Sign in to join the discussion.