🌍 Public
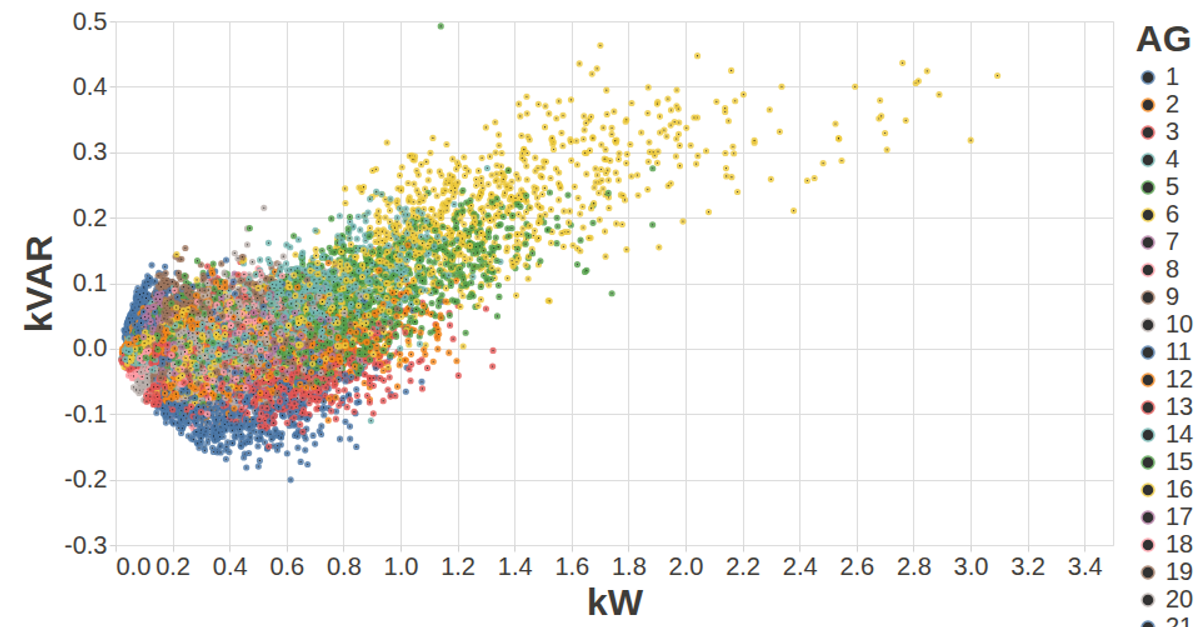
Vega-Lite MFRED Hourly Kw vs kVAR
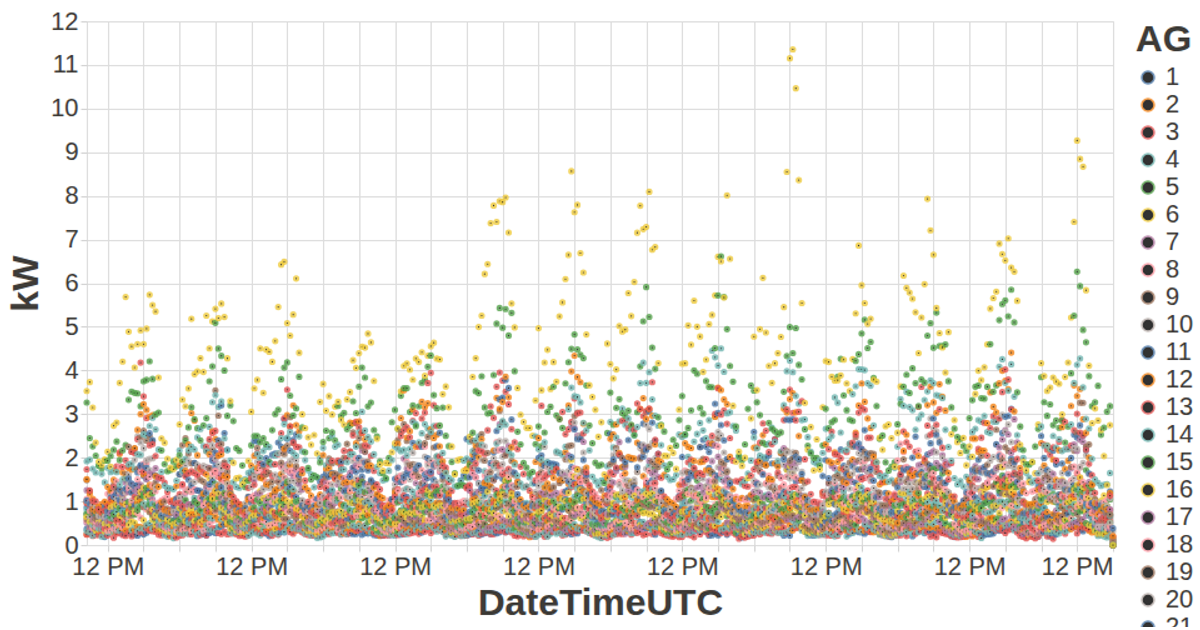
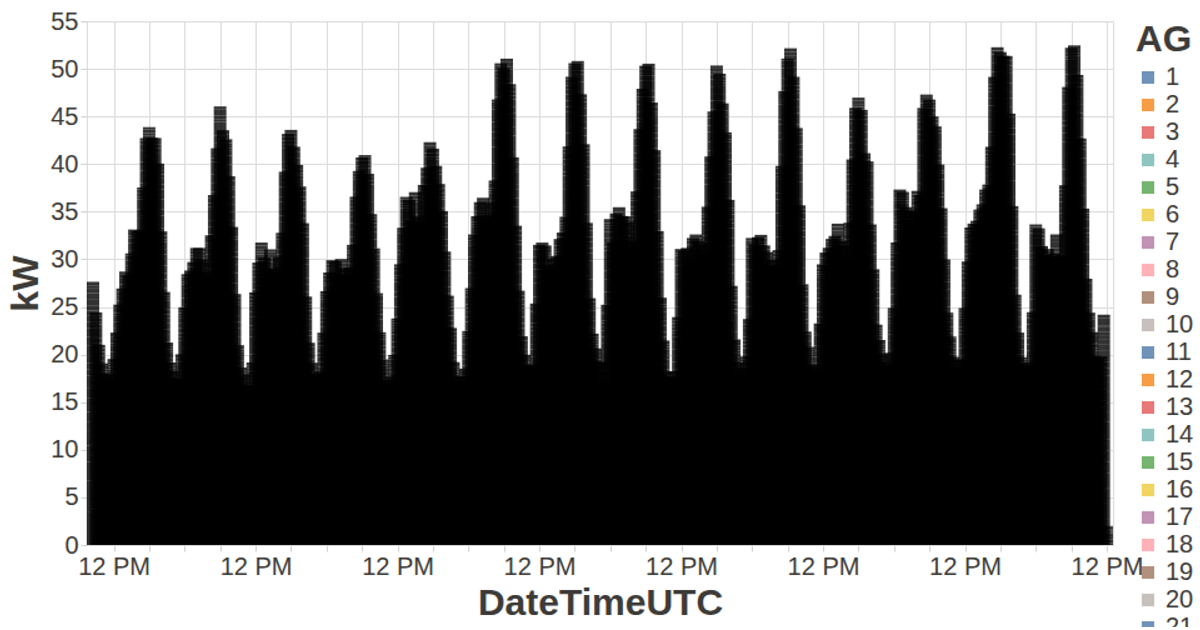
This visualization plots hourly electrical power measurements from the MFRED dataset, comparing kilowatts (kW) against kilovolt-amperes reactive (kVAR) for multiple aggregated generator groups. Each point represents one hour of data, colored by generator group, with tooltips showing the group name. The code uses the Vega-Lite API with d3.v5 for data loading and grouping, converting 15-minute CSV data into hourly totals before rendering the scatter plot with configurable axis styling.
AI-generated descriptionA visualization constructed using the vega-lite-api.
MIT Licensed


Comments
Sign in to join the discussion.