🌍 Public
vikas Pie chart
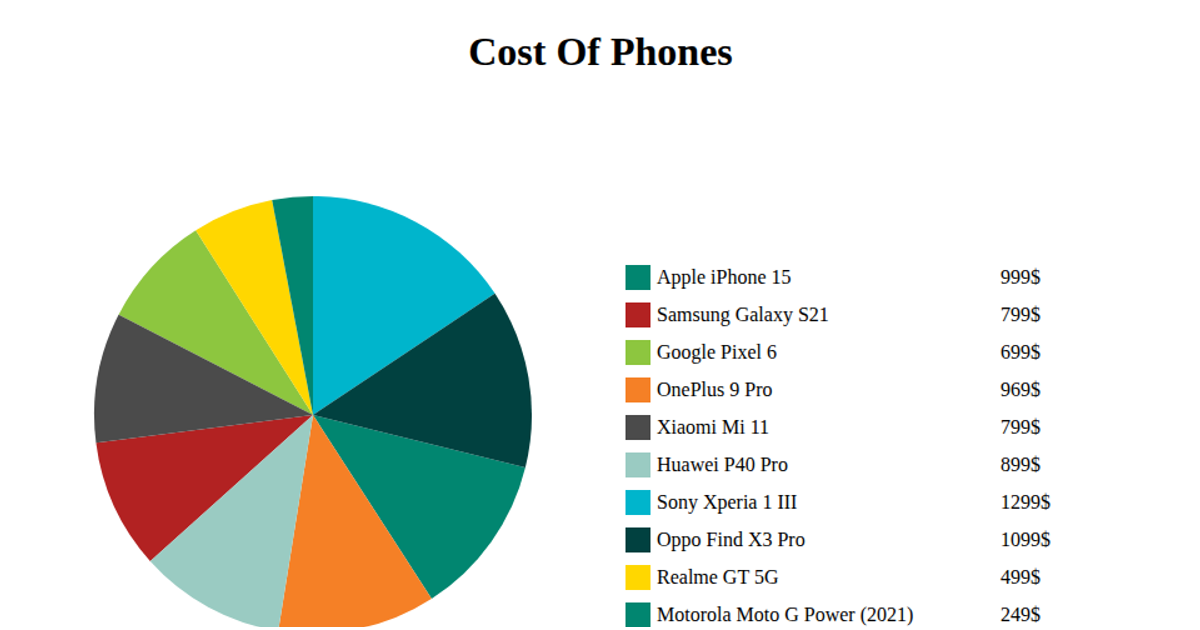
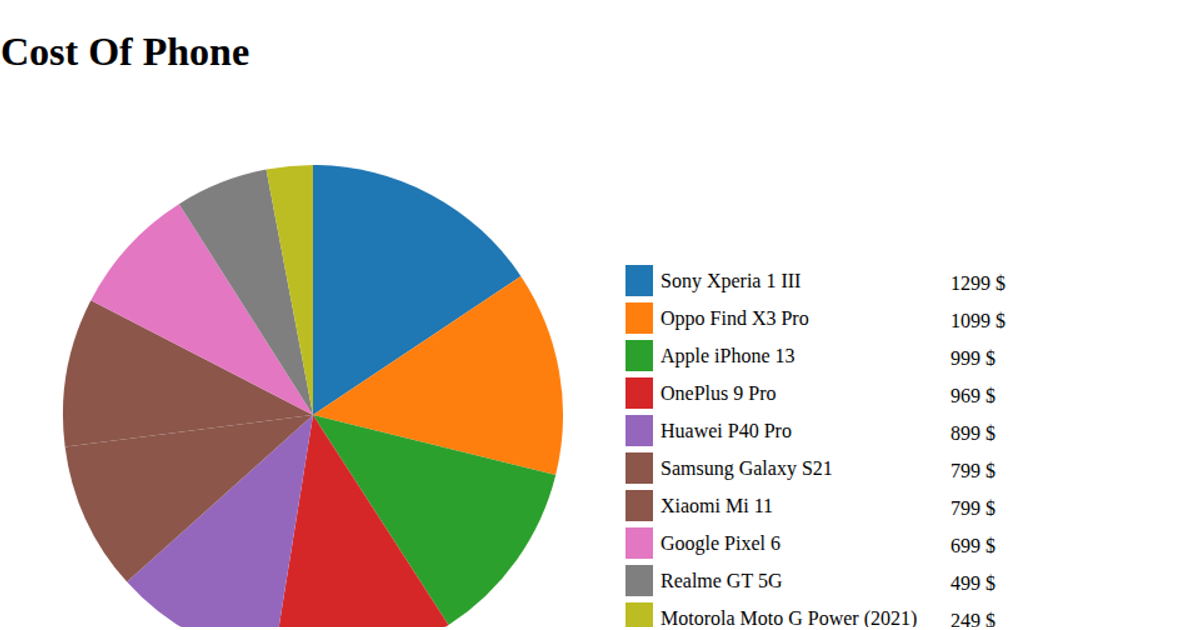
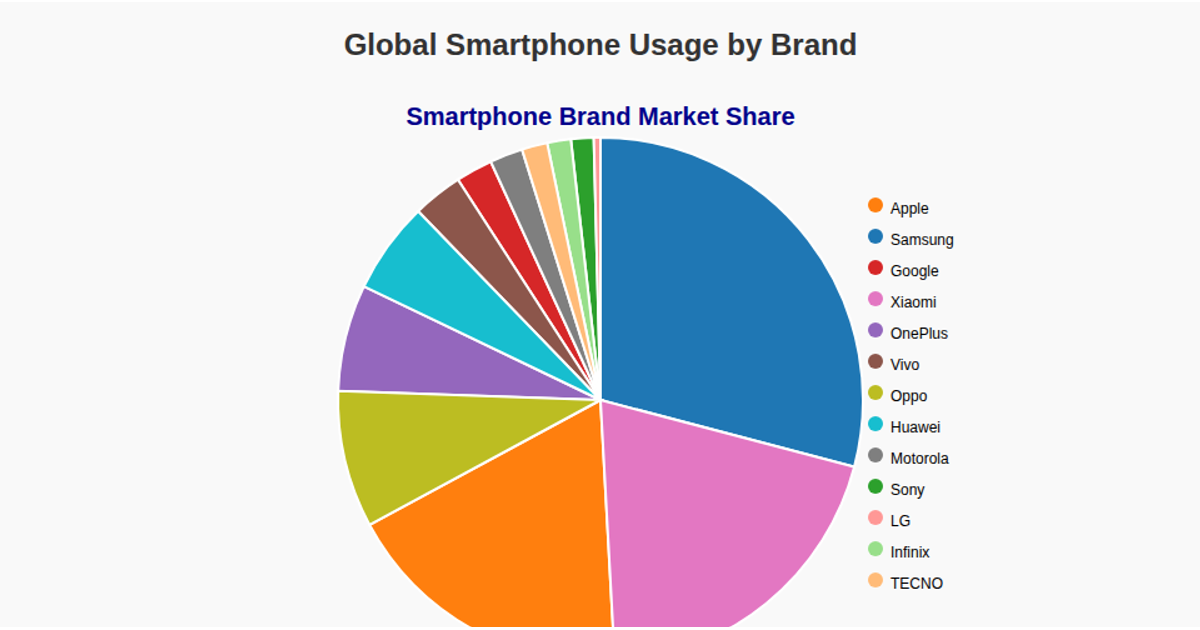
This pie chart visualizes estimated phone usage by brand and model worldwide, with each slice representing the number of users in millions. The chart displays a legend on the right listing each phone model alongside its corresponding user count. Built with D3 v5, the visualization uses `d3.pie()` to compute the arc data, `d3.arc()` for the SVG path generation, and `d3.scaleOrdinal` with the category10 color scheme for slice coloring. The data is loaded from a remote CSV file using `d3.csv()`, with mouseover events logging the user values to the console.
AI-generated descriptionMIT Licensed




Comments
Sign in to join the discussion.