🌍 Public
Vikas Pie Chart
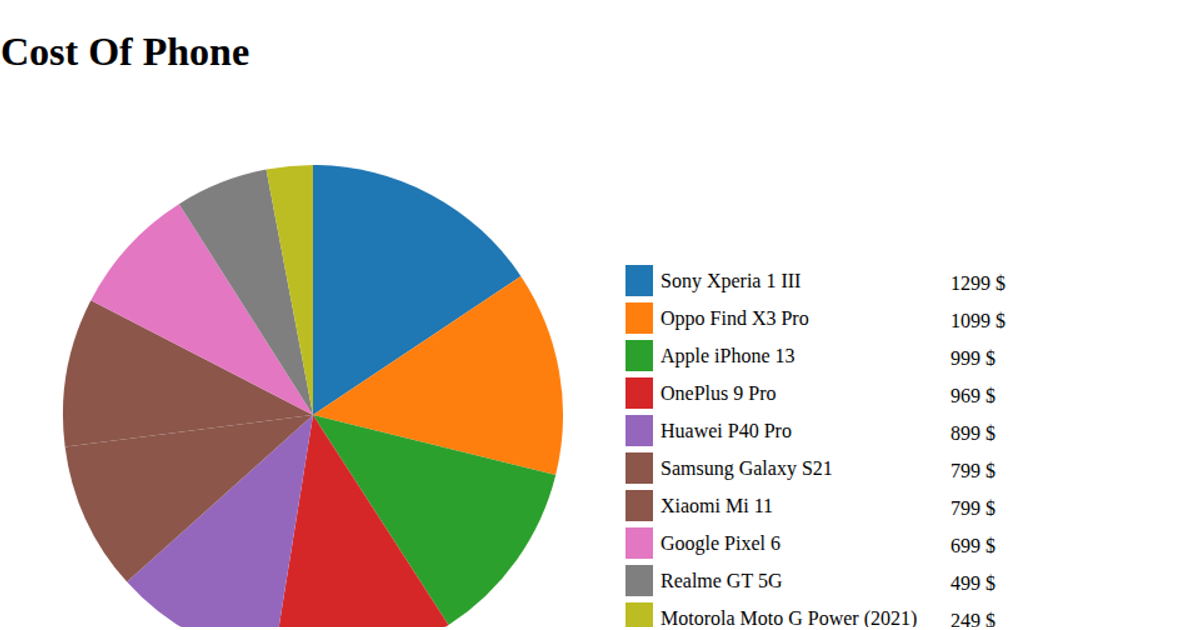
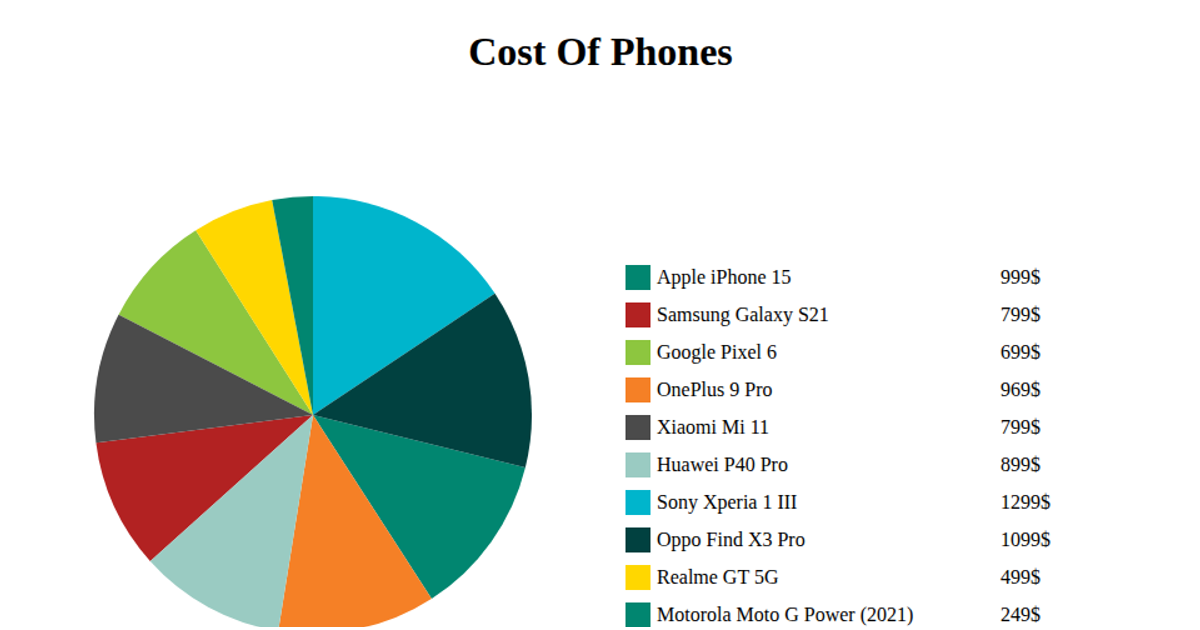
This example visualizes the cost of ten different phone models using a pie chart, with each slice representing a phone’s price in dollars. The chart is rendered as an SVG using D3 v5 within a React application, leveraging the `pie` and `arc` generators to compute and draw the slices, while `scaleOrdinal` with `schemeCategory10` assigns distinct colors. The data is loaded from a CSV file via `d3.csv`, sorted by price, and displayed alongside a legend that pairs each phone’s name with its price. Hovering over a slice logs the price to the console, though no other interactive behavior is implemented.
AI-generated descriptionA bare minimum HTML page demonstrating use of CSS and JavaScript.
See also React Starter.
MIT Licensed




Comments
Sign in to join the discussion.