🌍 Public
Vikas Pie Chart
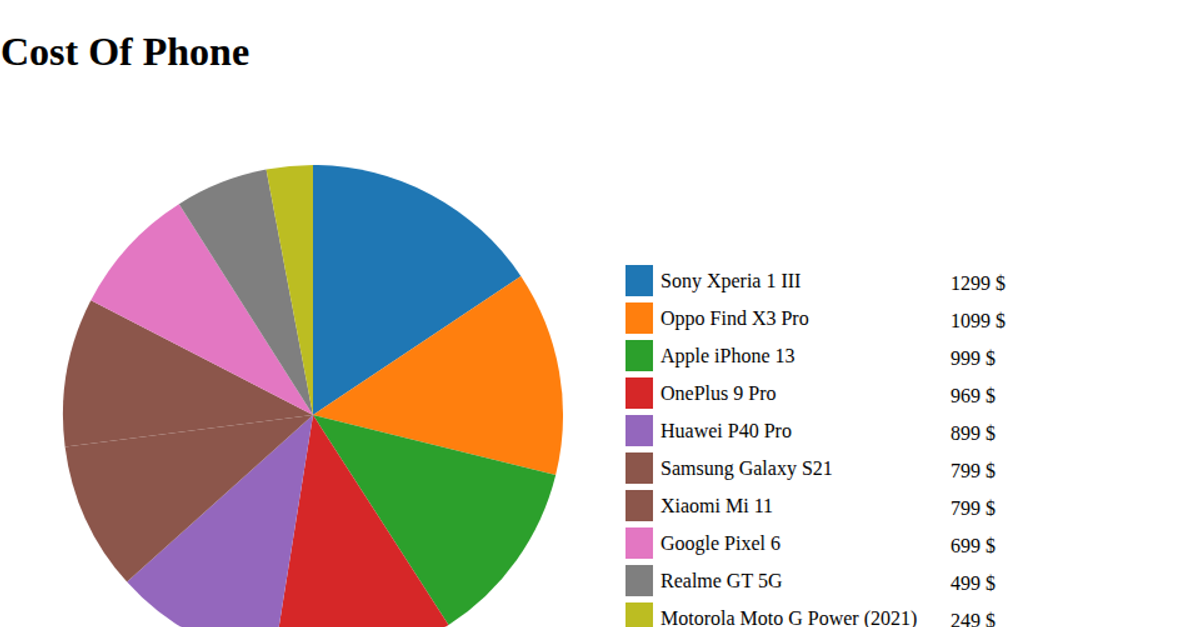
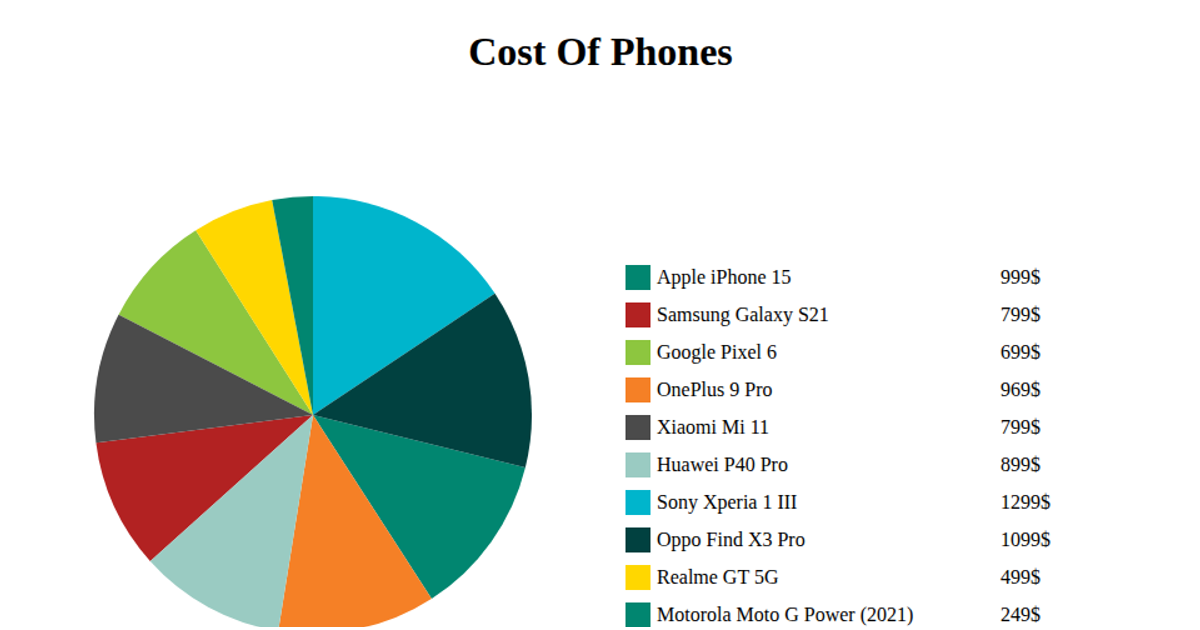
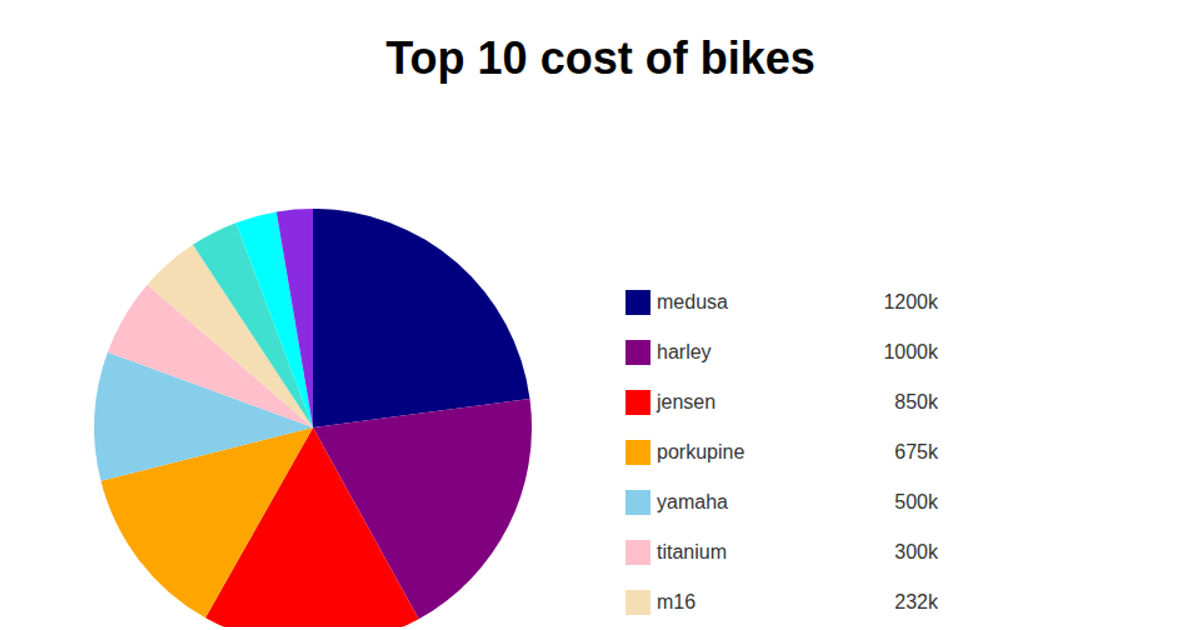
This example visualizes the cost of ten phone models from a CSV dataset, displaying each phone’s price as a pie slice with a legend on the right. It uses D3 v5’s `pie`, `arc`, and `scaleOrdinal` with `schemeCategory10` to generate and color the SVG paths, while `csv` loads the data from a gist URL. Hovering over a slice logs its price to the console. The legend pairs colored rectangles with phone names and formatted dollar values, sorted descending by price.
AI-generated descriptionMIT Licensed



Comments
Sign in to join the discussion.