🌍 Public
Cost of Excessive Alcohol Consumption by State
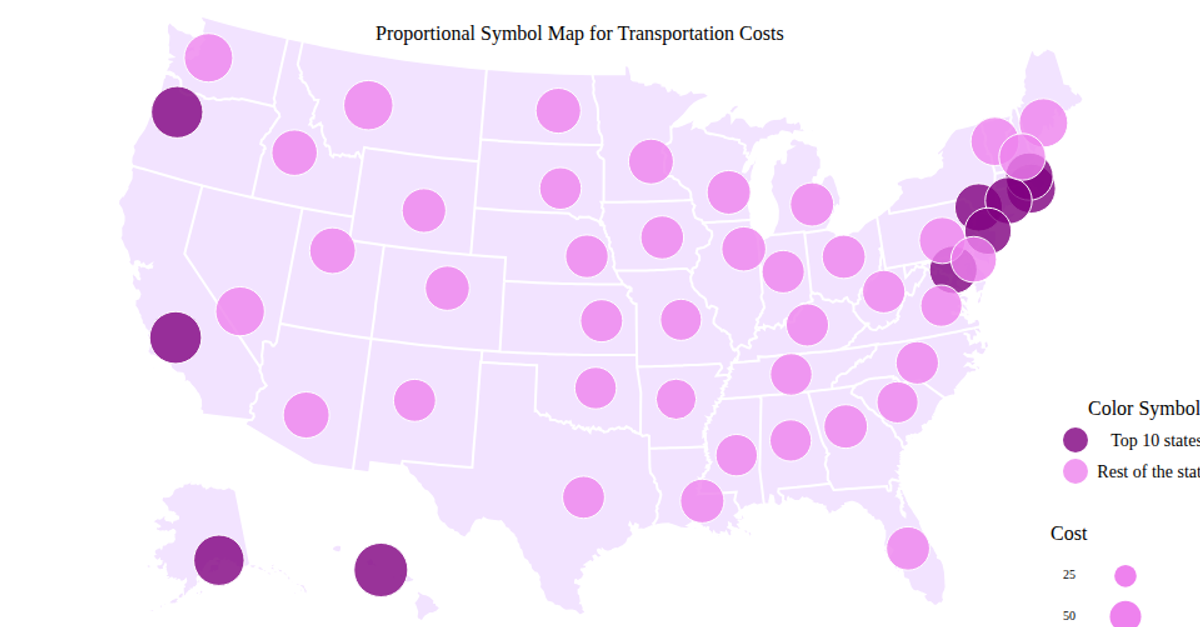
A choropleth on a Natural Earth projection shows the cost of excessive alcohol consumption per capita by U.S. state, with circles sized by state population. The visualization uses React to render an SVG, importing `d3.geoEqualEarth`, `d3.geoPath`, and `d3.geoGraticule` for the map and graticule, while `d3.scaleSqrt` maps population to circle radius. State boundaries come from TopoJSON’s `states-10m.json`, and cost data is loaded via `d3.csv` from a GitHub gist. Land and sphere fills are styled in CSS, with semitransparent teal circles overlaid on the map.
AI-generated descriptionMIT Licensed




Comments
Sign in to join the discussion.