0 views in last 90 days
Andre J Denais
@andre6639
Skater. Sailor. Problem Solver.
Public vizzes
Fork of Fork of USA Country Map

Fork of Sine Wave Circles
us test

Fork of Messing around with Sine Wave Circles

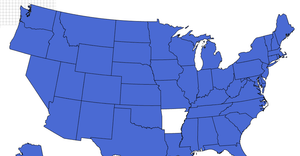
Fork of United States Educational Attainment - Choropleth Map

SFO & Oceanside NOAA Summary of the Month 1946-2020 with Menus & Legend

Fork of Mathematical Graphic Patterns
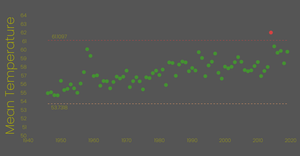
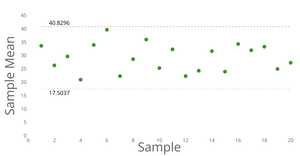
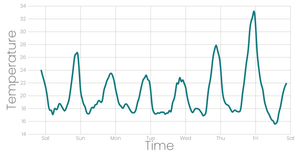
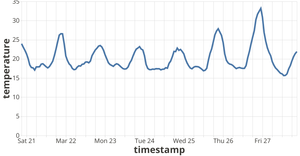
React D3 Conditional Line Chart Practice - SFO Temp X-Bar
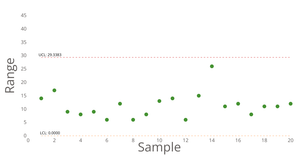
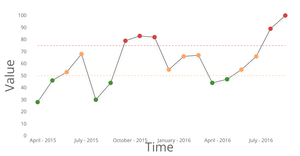
React D3 Conditional Line Chart Practice - Tires R-Chart
React D3 Conditional Line Chart Practice - Tires X-Bar
React D3 Conditional Line Chart Practice

Sine Wave Circles Playground

Fork of Radial Stacked Bar Chart of Personal Electric Usage Data By Year for Account

Fork of Dragging HTML Elements 2
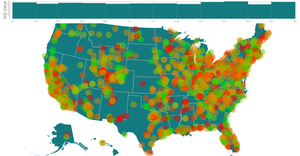
Fork of AQI Data in America in 2021 with Histogram and Brushing

Fork of NASCAR Scatterplot With Dropdown, Filter
Fork of United States Educational Attainment - Choropleth Map
Fork of Waste-Aggregation by gates

Animated Reusable D3 Scatter Plot Black and White
Animated Labels Reusable D3 Scatter Plot Black and White
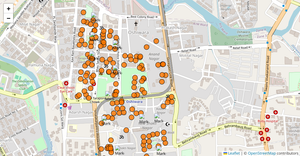
Missing Migrants on a Map with Fast Brushing Bars

SmileyPart3

Crime in India Dashboard
Fork of Brush, Trendline, Legend, Title, Linechart, Barchart
Fork of Brush, Trendline, Legend, Linechart, Barchart

Wind Rose DateHistogram
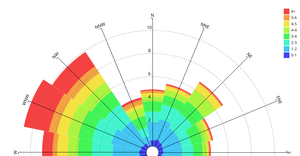
Wind Rose Starter Playtime

Fork of D3 map drag demo
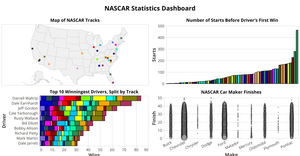
Fork of Nascar Dashboard I- Just Plots

Fork of Line Chart for ILINet Flu Surveillance Data

NASCAR Stats Dashboard Template

Fork of Swedish map
Fork of Scatter Plot with brushing - Number of deaths by alcohol and drug risk factor per 5 countries.

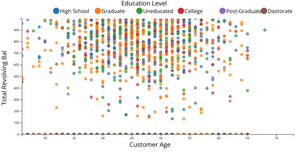
BankInfo Barchart Practice
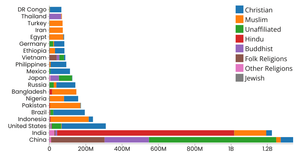
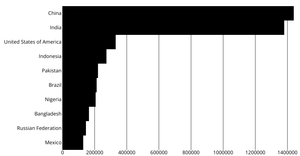
Fork of Religions of Largest 20 Countries

Practice with flying Barchart
Some Practice JS

Wind Rose Starter

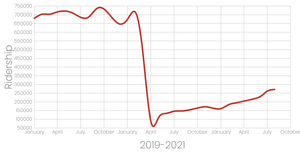
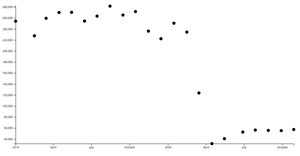
Golden Gate Transit Bus Ridership 2019-2021 Tooltip
Golden Gate Transit Bus Ridership 2019-2021
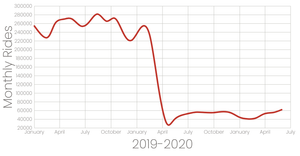
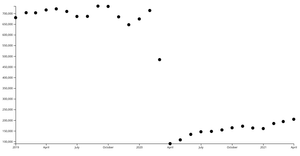
Muni Ridership 2019-2020/Pandemic

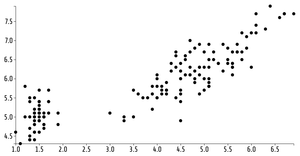
The Basic Reusable D3 Scatterplot Black and White

GGT and MUNI Animated D3 Scatter Plot

The Animated Reusable D3 Scatter Plot
The Dynamic Reusable D3 Scatter Plot
Reusable Cycle D3 Scatter Plot Black and White

Animations Practice

Fork of City density filtering by population and proximity

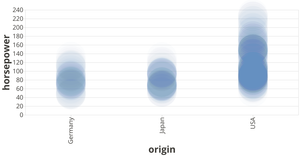
MPG Scatter Plot, Color & Interactive Legend
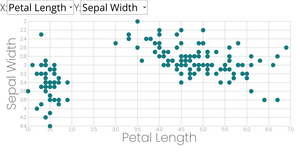
Scatter Plot with Menus Legend

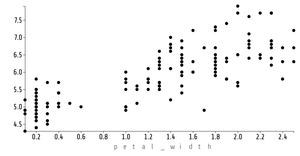
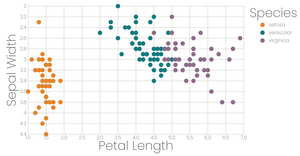
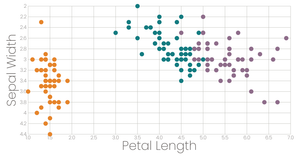
Scatter Plot with Menus include Species
Animated Reusable D3 Scatter Plot Black and White

SVG Animation Playground

MPG Scatter Plot with Menus

Fork of SVG shapes and animation sandbox

Fork of SVG Playing Around and Studying
SFO NOAA Summary of the Month 1955-2020 Playground with Vega-Lite API
US Map practice

D3geo Playbox
HIV/AIDS Choropleth Map
Stylized Bar Chart

San Francisco County Map

Map Practice ArcGis import

Map Practice HTML Starter
Psuedo Spider Chart

World Suicides Scatter Plot with Menus
Animated Scatter Plot with Menus
Animated Menus Scatter Plot

JS playground

Animated Vehicle Consumption Scatterplot
Car Dimensions Simple
Reusable D3 Scatter Plot Symbols B and W

D3 Scatterplot Black and White Template
Golden Gate Transit Ridership B&W Scatterplot
Muni Average Daily Boardings B&W Scatterplot
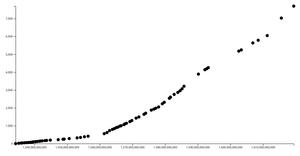
VizHub Users Scatterplot B&W

D3 Scatterplot Black and White Basic

SVG Fundamentals

JS in HTML

D3 Selection Exploration

JavaScript Arrays

HTML Starter

Final Full Sol LeWitt Reproduction with D3

Full Sol LeWitt Reproduction with D3 Draft

Sol LeWitt Reproduction with D3

V1 Sol LeWitt Reproduction with D3

Sol LeWitt Reproduction Final

Sol LeWitt Reproduction Mask Inverse

Sol LeWitt Reproduction Mask

Sol LeWitt Reproduction Vertical

Sol LeWitt Reproduction

Psuedo Scatter Pot

Psuedo Bar Chart 2

Psuedo Bar Chart

Psuedo Horizontal Bar Chart

Missing Migrants on a Map with Fast Brushing Bars (V1)

HistogramPractice Corpus Christi & SFO 2015-2020 DailyClimateData with Menus & Legend

Map Projection

Texas NOAA Summary of the Month 1946-2020 with Menus & Legend

Coronavirus with Labels
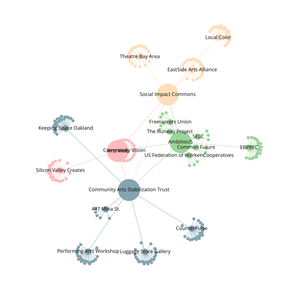
Organization Graph Diagram

Force Directed Graph Starter

Coronavirus Multiple Lines with Voronoi Overlay
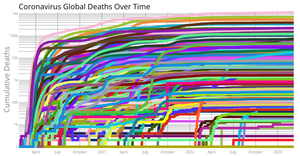
Coronavirus Multiple Lines
Coronavirus Visualization Labels
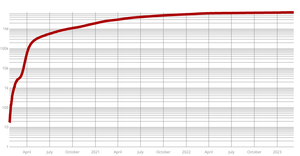
Coronavirus Log Y Axis
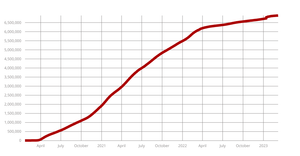
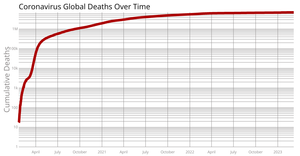
Coronavirus Linear Y Axis
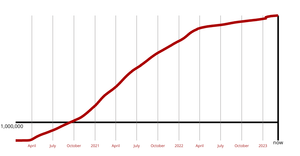
Coronavirus 1,000,000 line React + D3 Axis

MM on a Map Multiple Views with Brushing V2.1

Summarizing Coronavirus Data
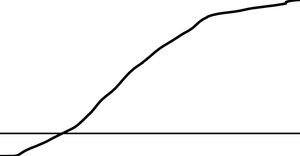
Coronavirus Basic Line Chart with 1,000,000 line
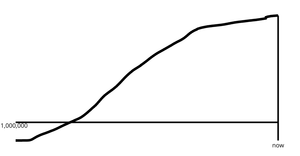
Coronavirus Basic Line Chart with 1,000,000 line Margin Convention

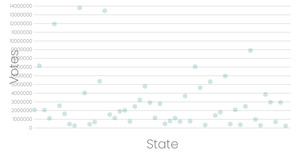
Cost of Excessive Alcohol Consumption by State
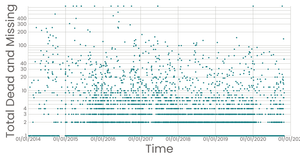
Missing Migrants Scatter Log Scale
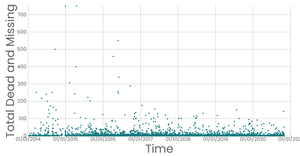
Missing Migrants Scatter
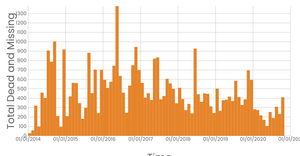
Missing Migrants Line Chart
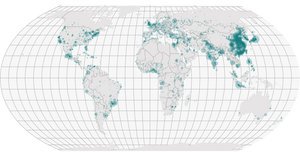
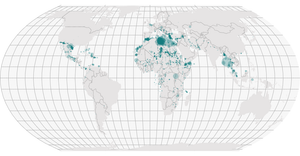
Points on a Map

Cost of Excessive Alcohol Consumption By State

Barchart
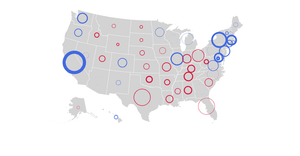
Playground 2020 presidential election margins (preliminary results)
2016 US Vote Totals

MM on a Map Multiple Views with Brushing V2 (Slow)
MM on a Map Multiple Views with Brushing V2.3 (Curran'sFastBrush)
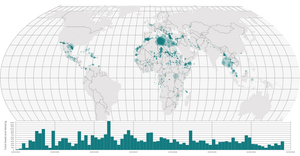
Missing Migrants on a Map Multiple Views

Corpus Christi and SFO Coordinate Plots
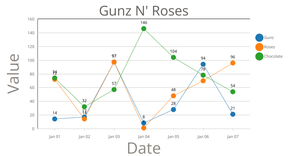
Gunz N' Roses Moving Points Template

Refactored Bar Chart
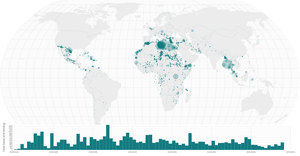
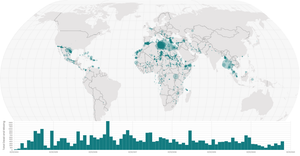
Missing Migrants on a Map

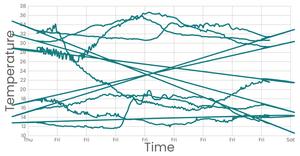
SFO 2015-2020 DailyClimateData with Menus & Legend

Corpus Christi & SFO 2015-2020 DailyClimateData with Menus & Legend
SFO & Oceanside NOAA Summary of the Month 1946-2020 with Menus
SFO Peak Wind History 2015-2020

Scatter Plot, Color & Interactive Legend
Scatter Plot, Slightly Stylized with Color & Legend
Scatter Plot, slightly stylized with color

Polished Scatter Plot with Menus!!
NOAA Summary of the Month with Vega-Lite API: Oceanside and SFO
Line Chart With Multiple Lines
SFO NOAA Summary of the Month 1955-2020 with Menus

Some energy consumption data by type from the eia
Scatter Plot with Menus!!
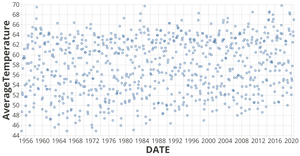
SFO NOAA Summary of the Month 1955-2020
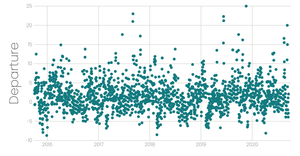
SFO Daily Departure From Normal Average Temperature 2015-2020

Menus with React

React Starter
Stylized Line Chart

World Map II
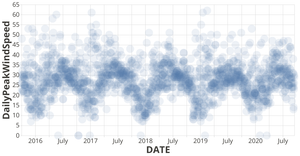
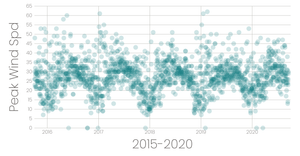
SFO Peak Wind Speed 2015-2020 with Vega-Lite API
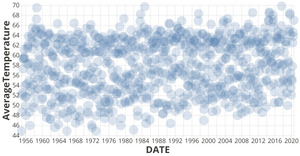
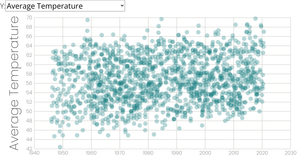
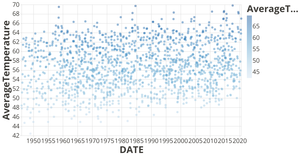
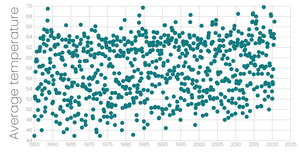
SFO NOAA Summary of the Month: Average Temperature 1955-2020 with Vega-Lite API
SFO NOAA Summary of the Month 1955-2020 with Vega-Lite API Template
My Second interaction with Vega-Lite API
Axes with React & D3

The Margin Convention

Rendering Bar Chart with React & D3

Rendering Data with React & D3

Loading Data With React and D3
My First interaction with Vega-Lite API

Loading and Parsing CSV Data

MouseFollower