🌍 Public
Fork of Fork of Swedish map
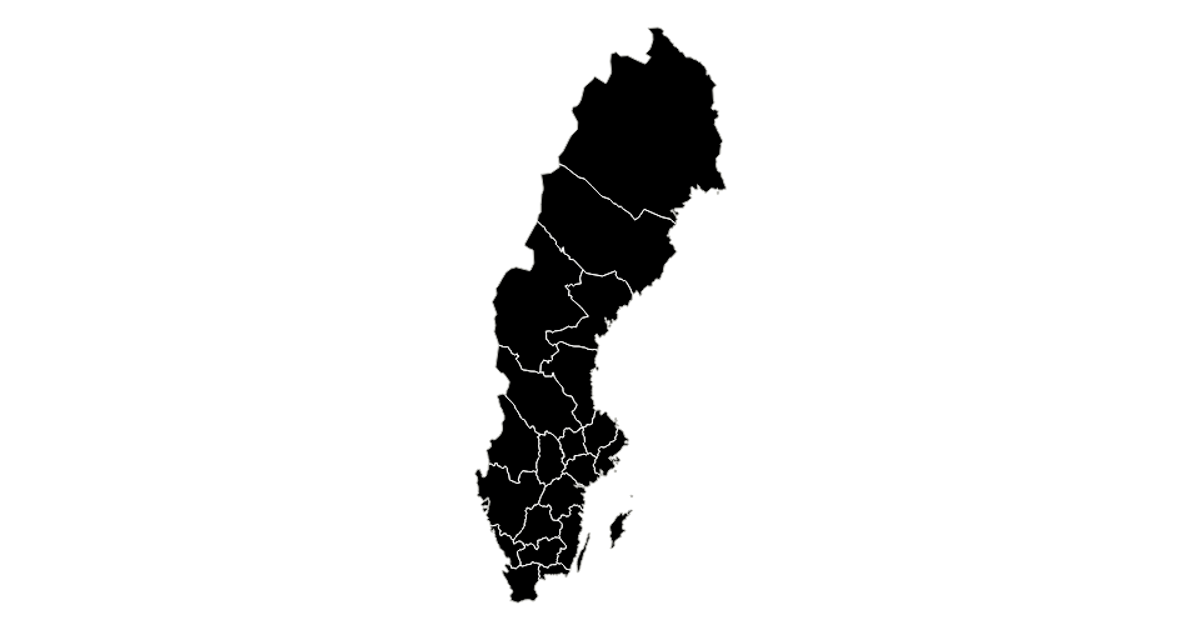
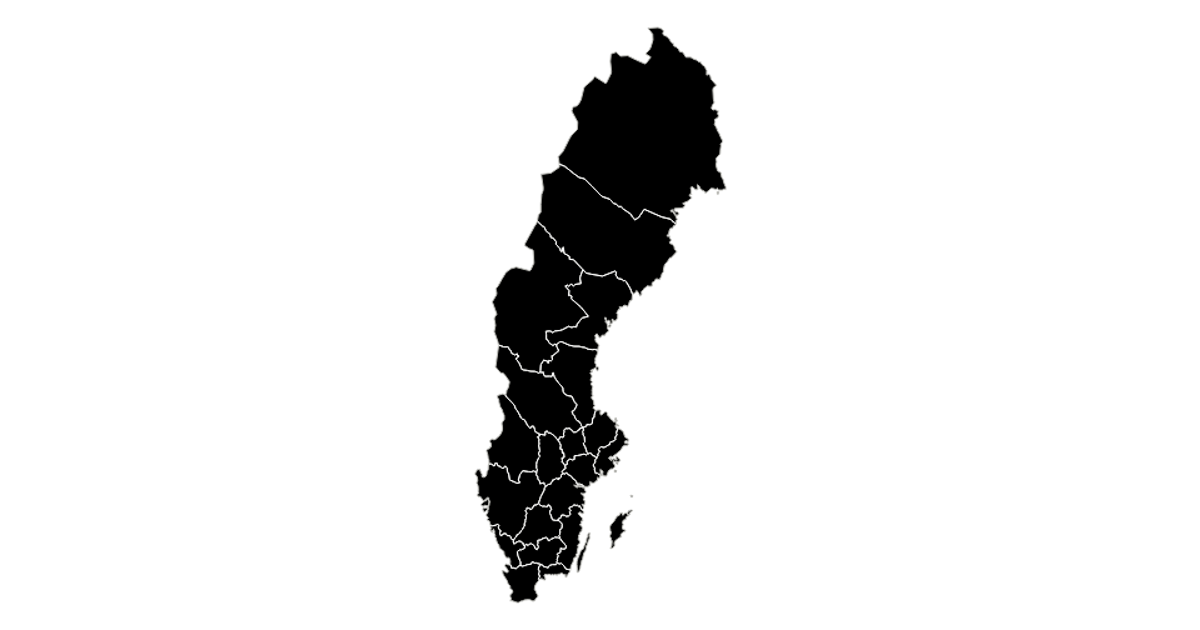
This visualization displays the counties of Sweden as solid black regions with white interior boundaries, rendered using SVG paths generated from TopoJSON data. The map uses a Mercator projection from d3-geo, with `geoPath` and `fitExtent` to scale and position the geometry within the frame. Built with React and D3 v5, the code fetches the Swedish county dataset via `d3.json` from a GitHub Gist, then applies `feature` and `mesh` from TopoJSON to extract boundaries and shared borders. The styling, defined in CSS, gives the map a high-contrast monochrome appearance.
AI-generated descriptionA scatter plot of Data Canvas Sense Your City Dataset.
MIT Licensed


Comments
Sign in to join the discussion.