🌍 Public
Fork of Fork of Swedish map
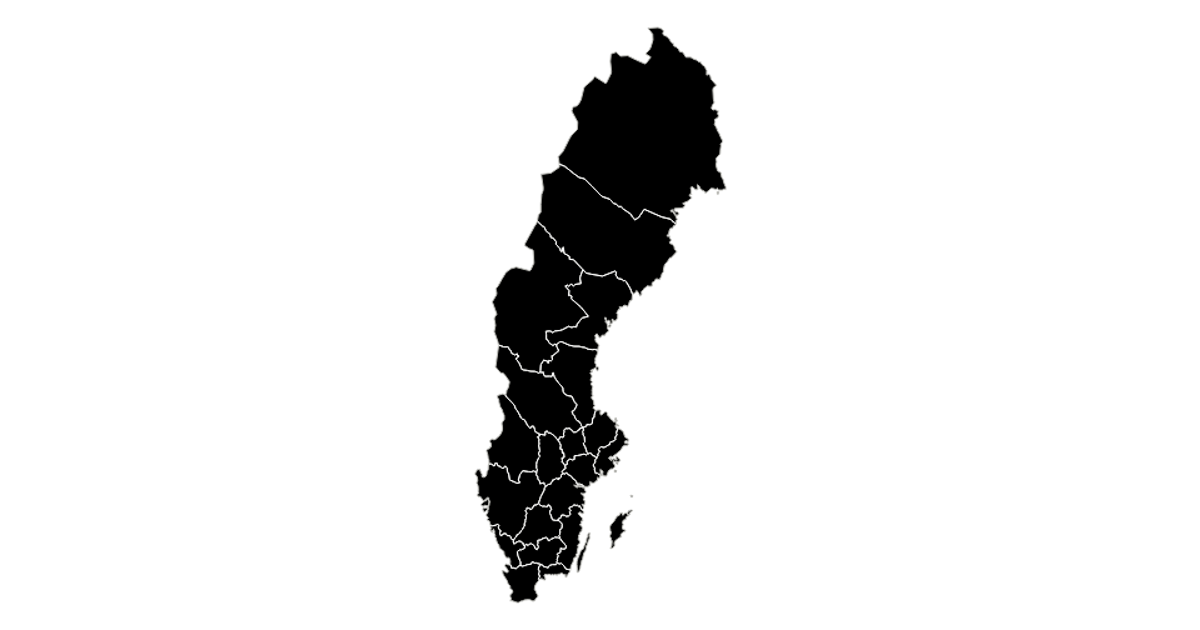
This example displays a map of Swedish counties using a Mercator projection, rendered as black filled regions with white internal borders against a silver stroke. Built with React and D3 v5, the code leverages `d3.geoPath` for path generation and `topojson` to extract features and interior boundaries from the GeoJSON source. The visualization highlights the country’s administrative subdivisions through a minimal, high-contrast styling.
AI-generated descriptionA scatter plot of Data Canvas Sense Your City Dataset.
MIT Licensed




Comments
Sign in to join the discussion.